DigitalFUTURES · Independent interface development · 2025
Healthy Ties
Community graphs & interface design
A completed DigitalFUTURES graph-modelling project, followed by independent interface and app-layout development.
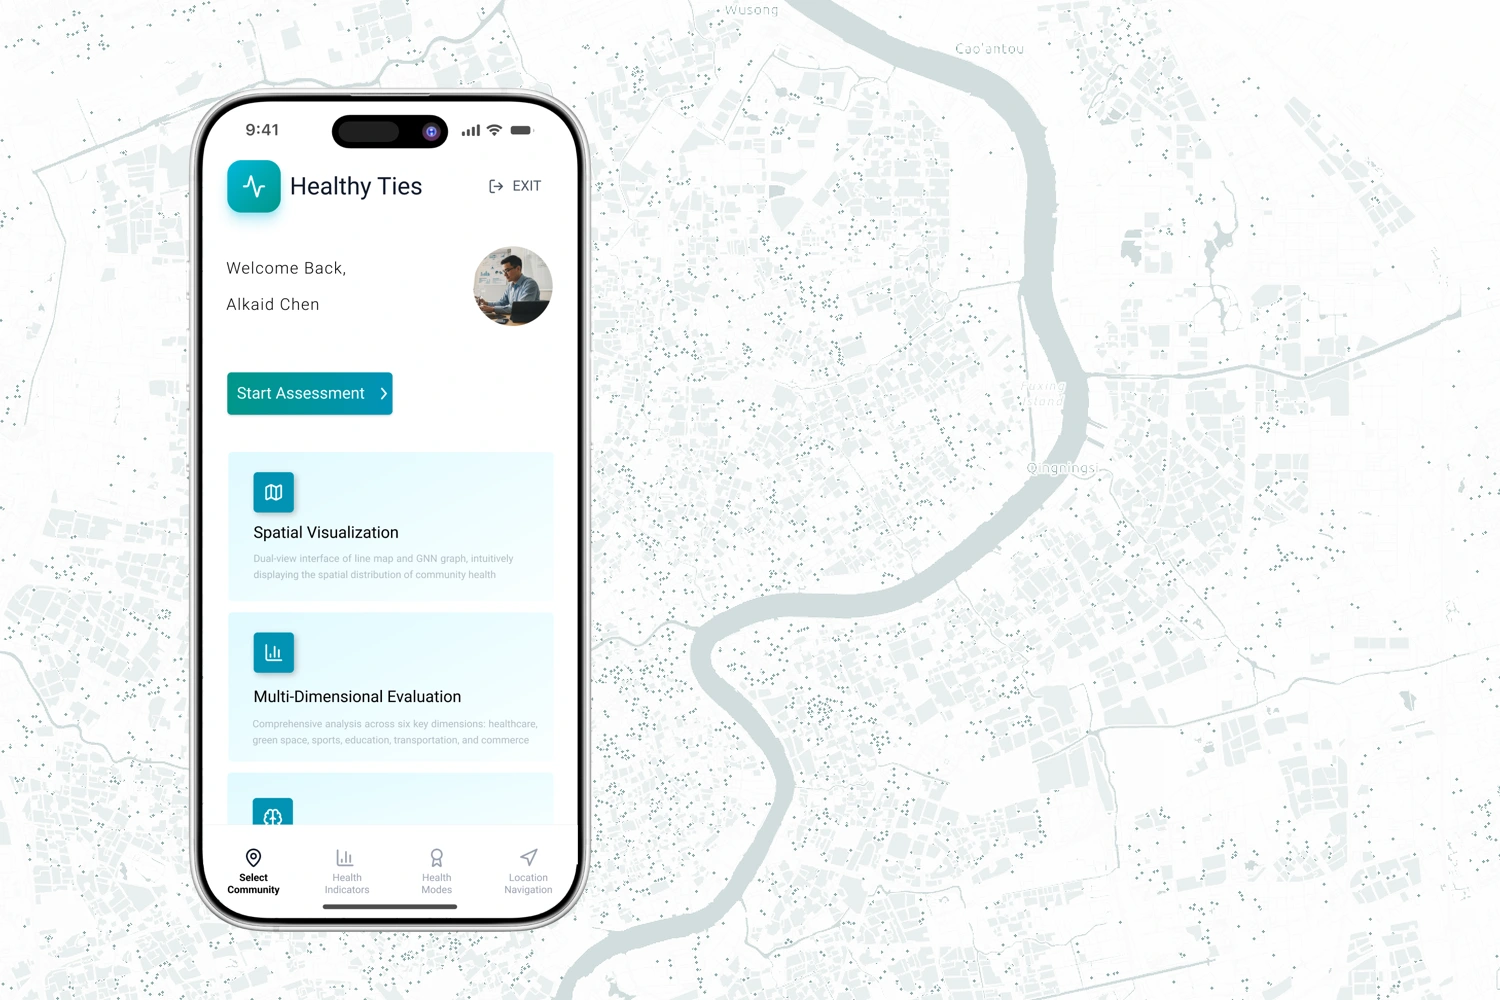
Original portrait cover
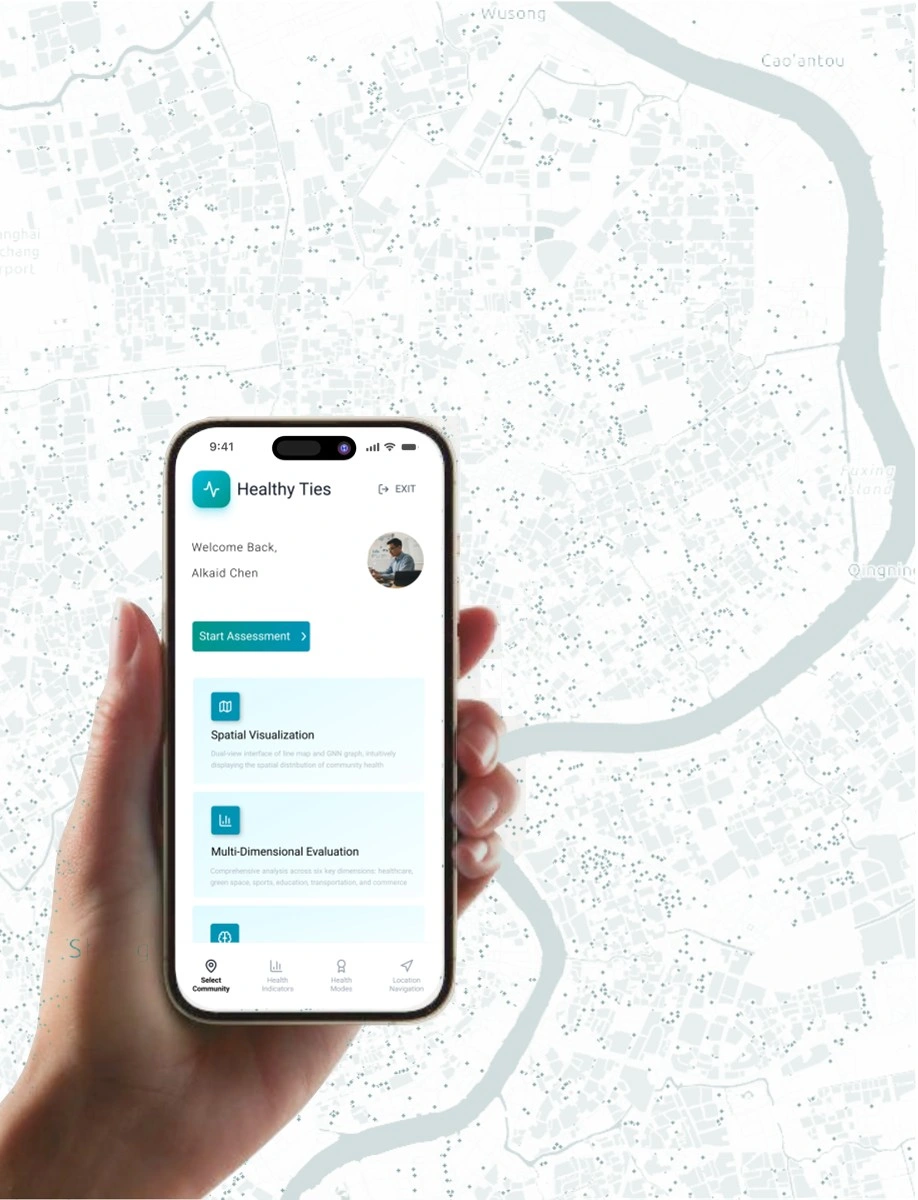
Representing a community
Healthy Ties explores the facilities and walking connections around a community. The graph representation joins spatial composition and accessibility in one analytical structure.
- Community
- Walking catchment
- Facilities
- Weighted connections
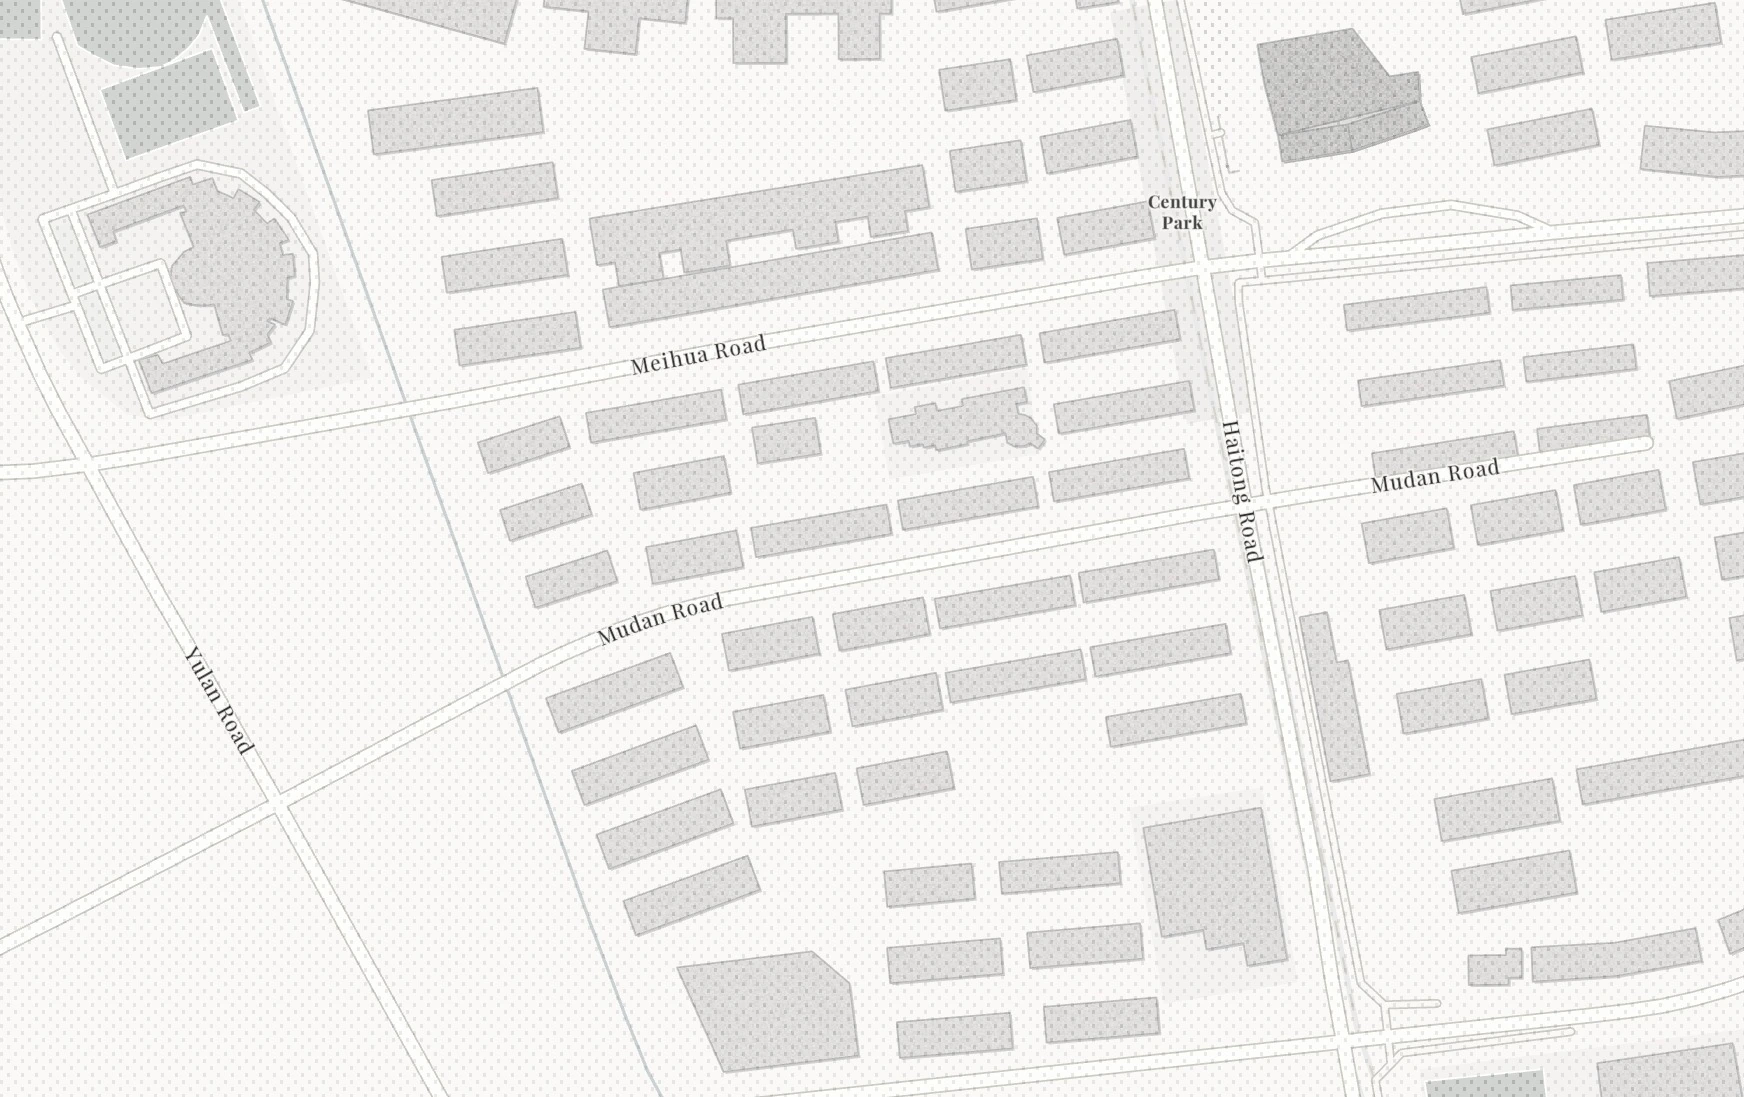
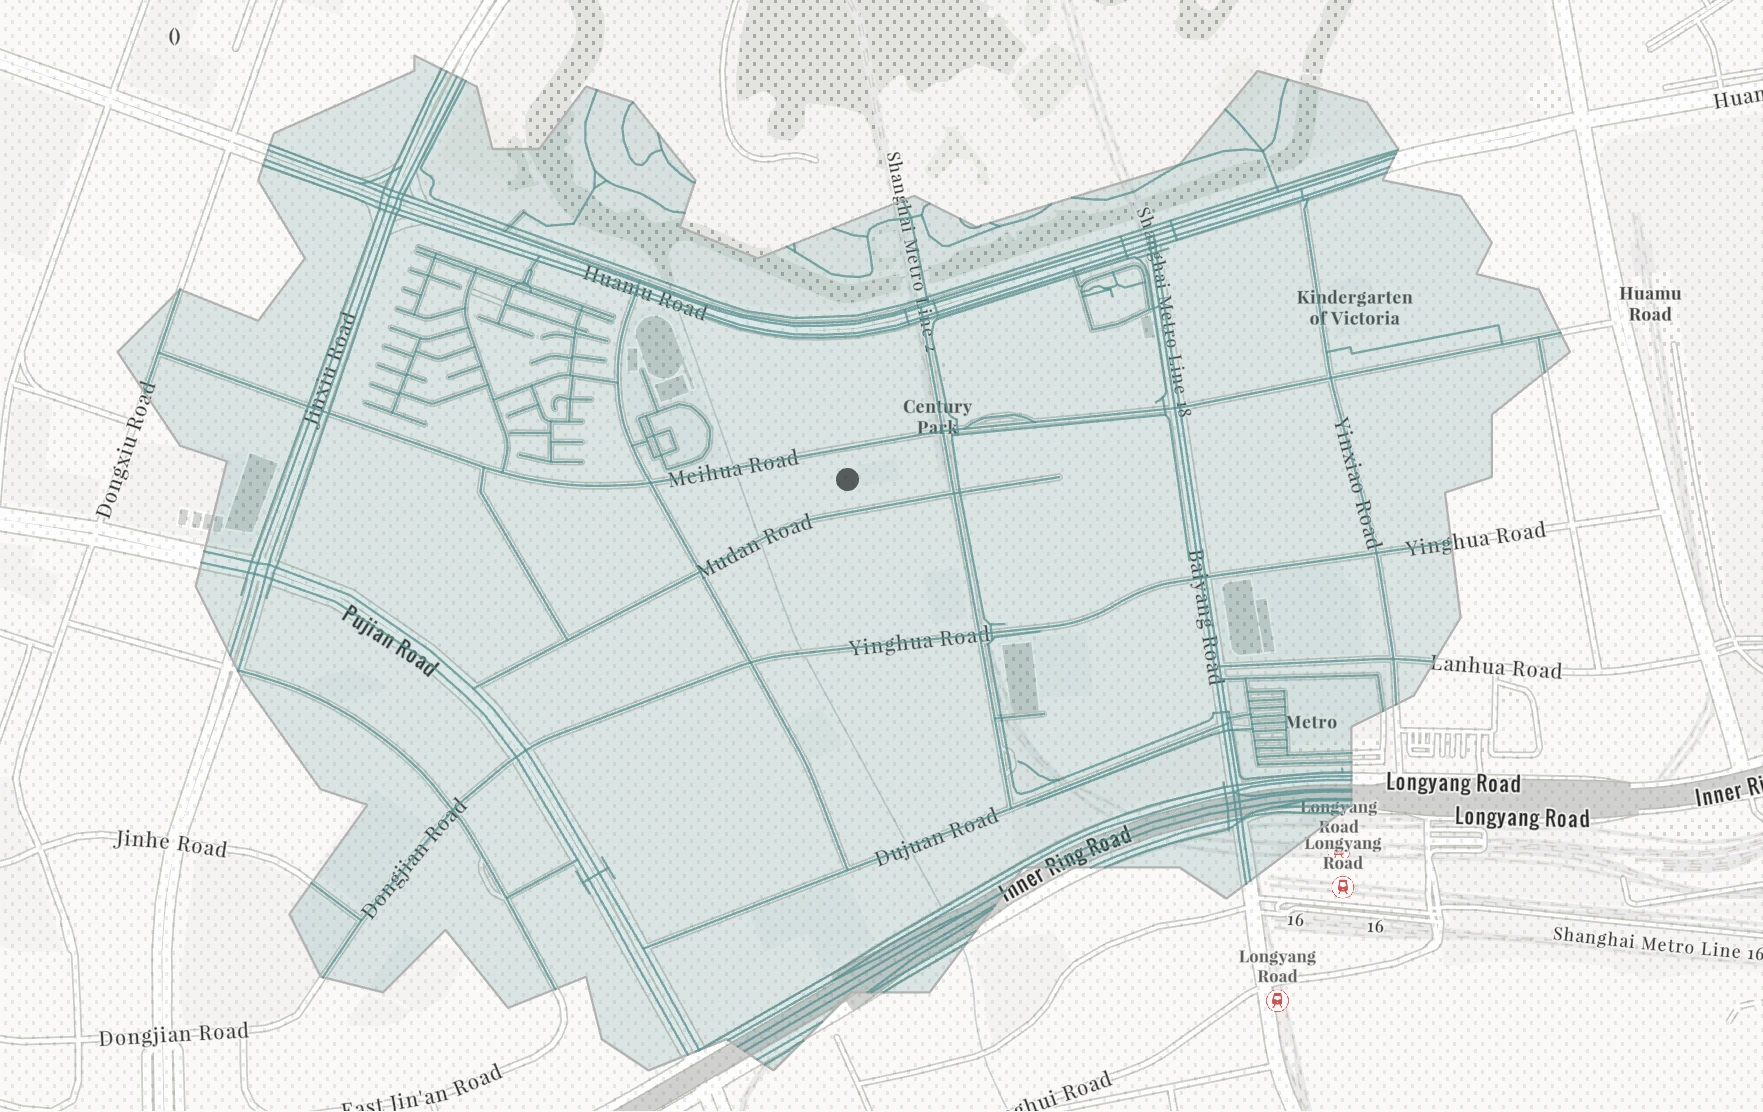
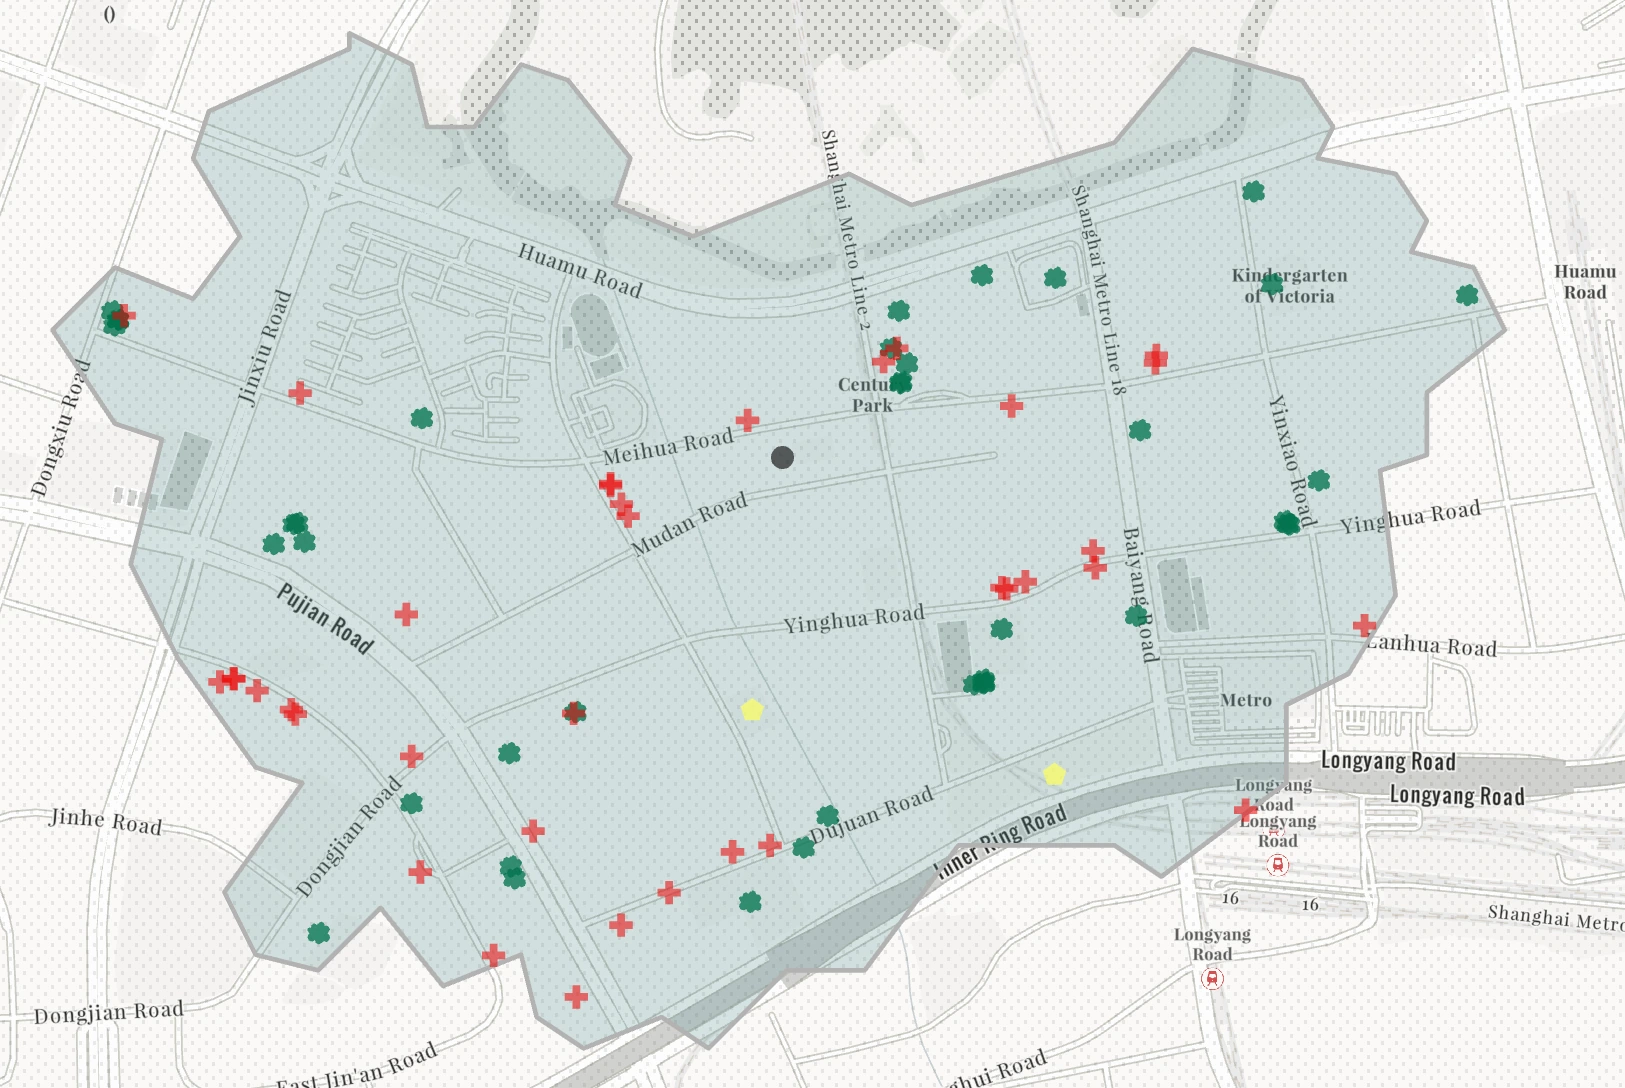
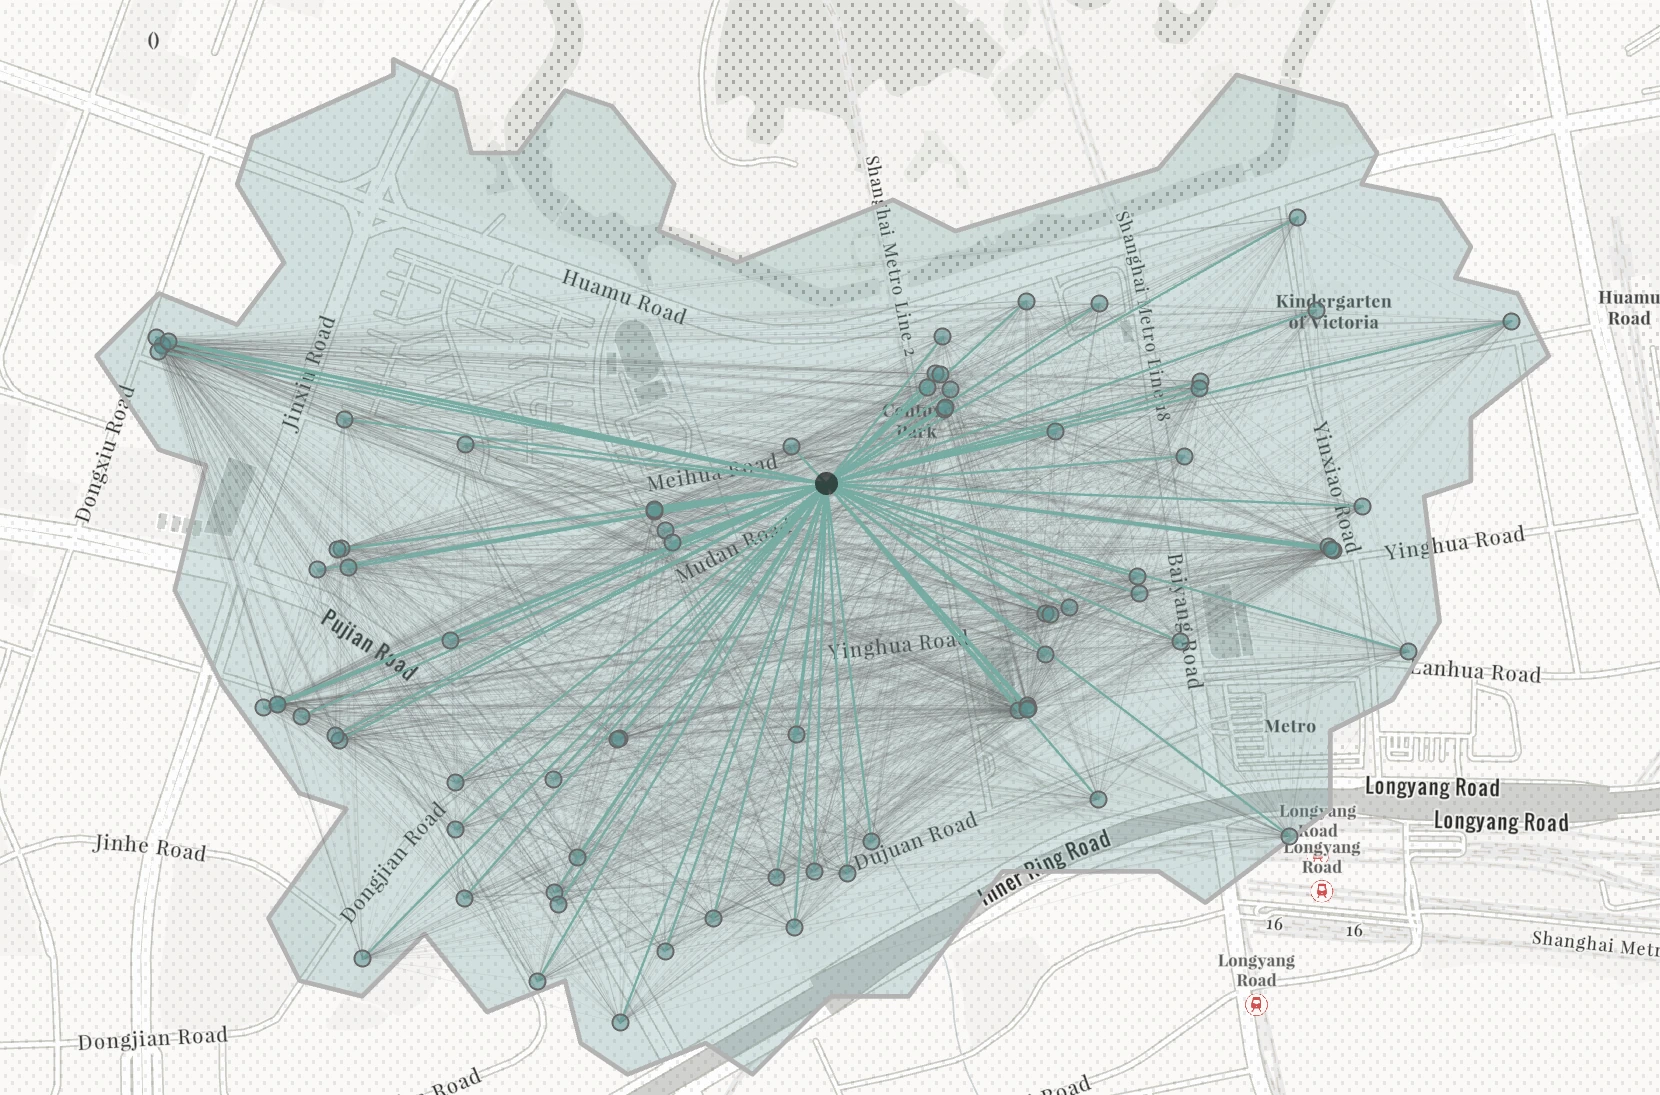
Nodes, distances and features
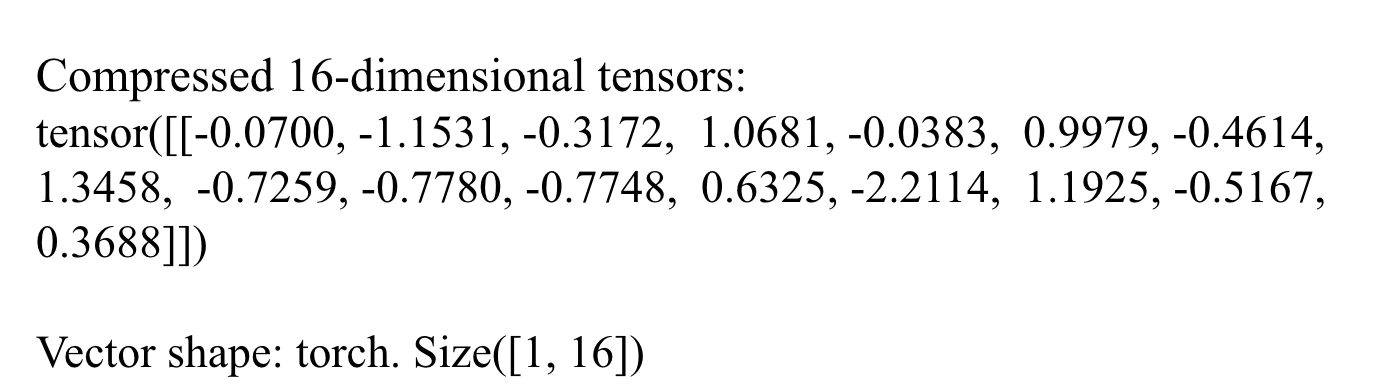
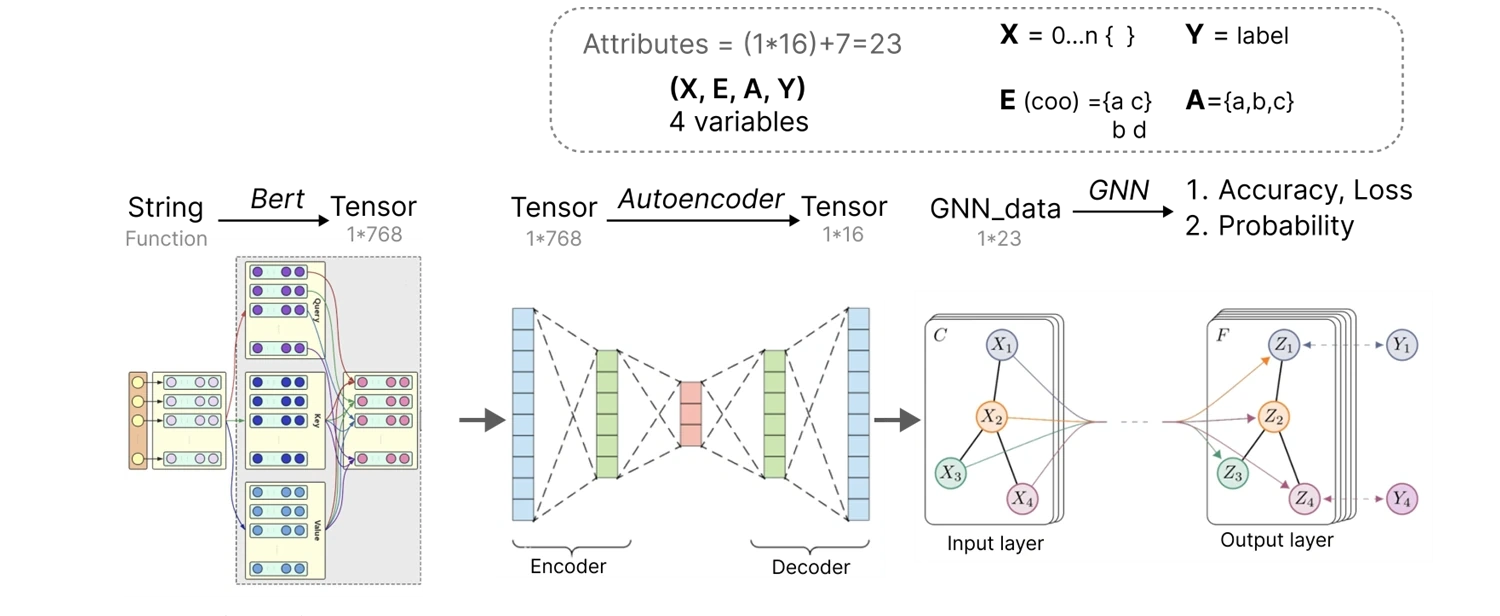
Communities and facilities form nodes. Walking-network distances define connections within 1,200 metres, with Gaussian distance-decay weights. Encoded features are compressed from 768 to 16 dimensions for the model.
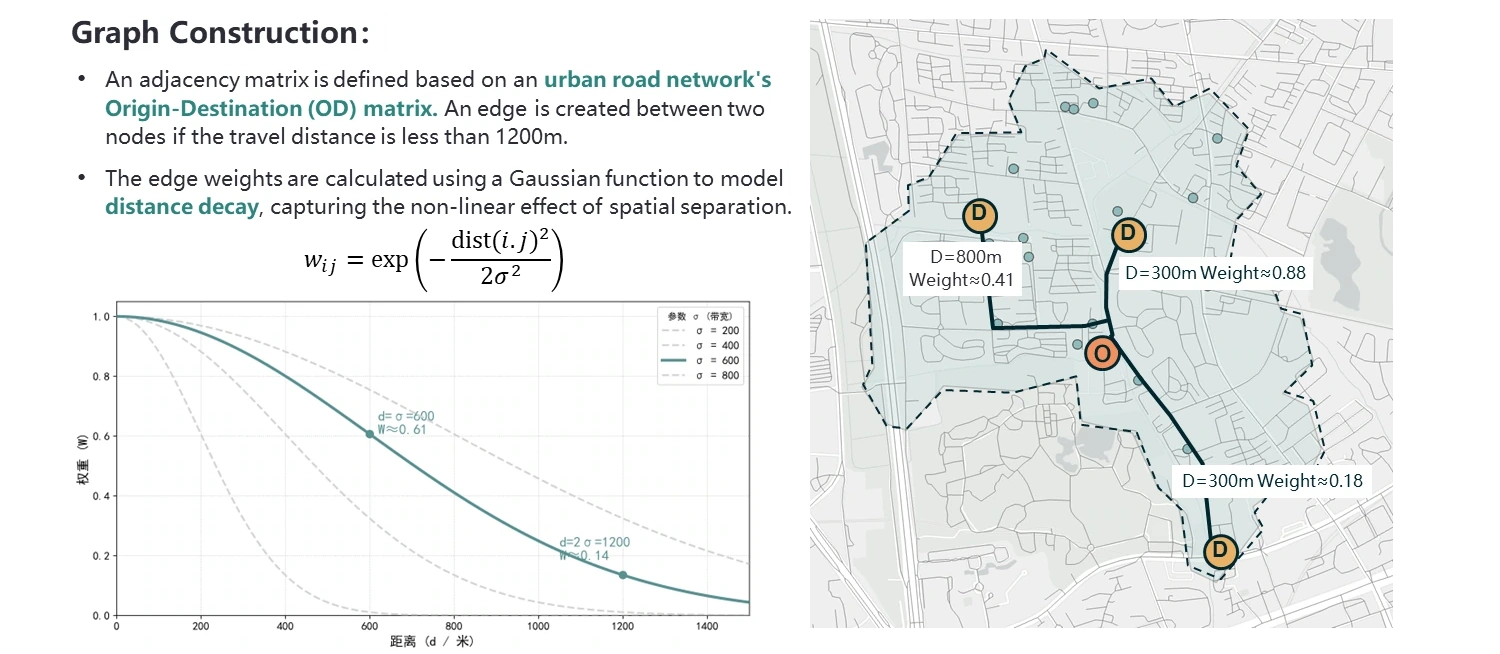
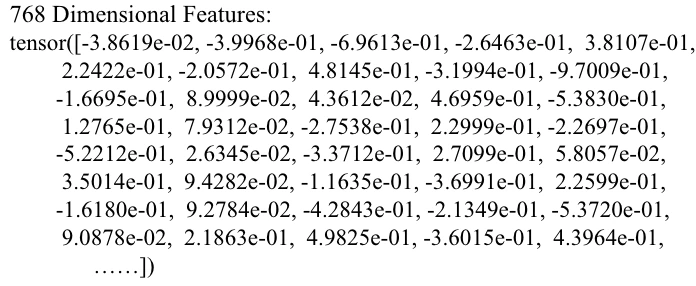
Comparing community subgraphs
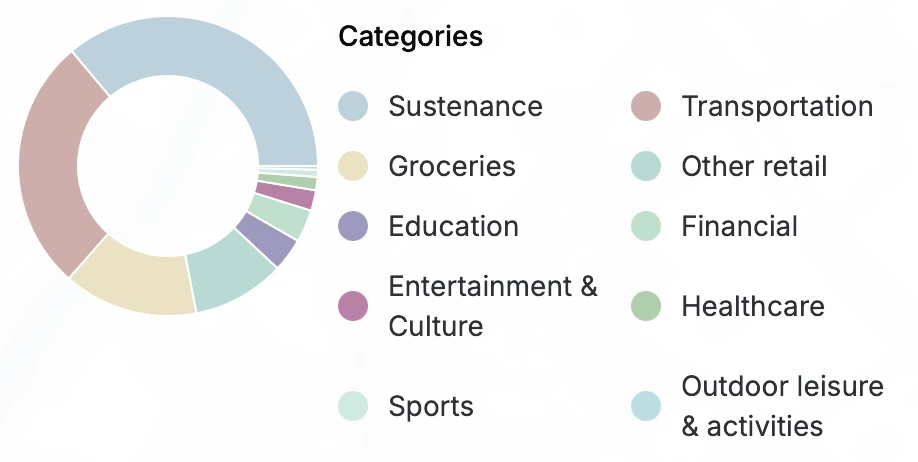
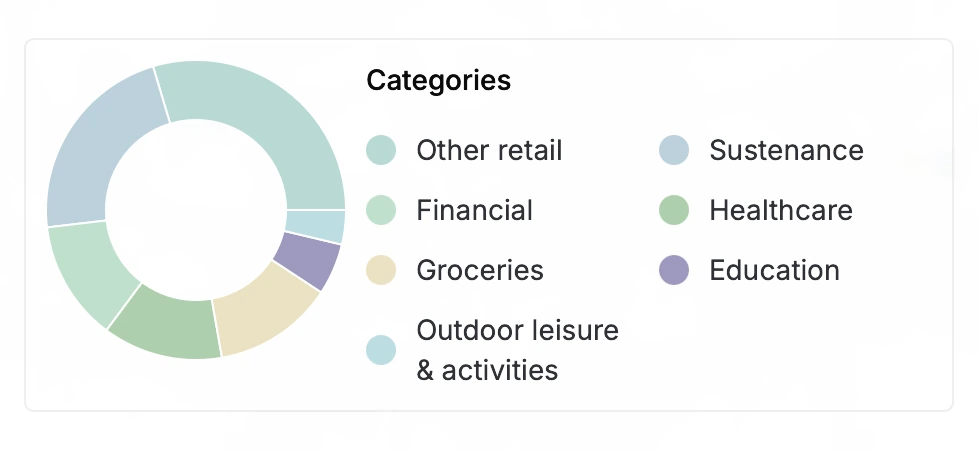
Different facility compositions and connections produce different subgraphs. The comparison preserves multiple examples rather than reducing the study to a single network image.
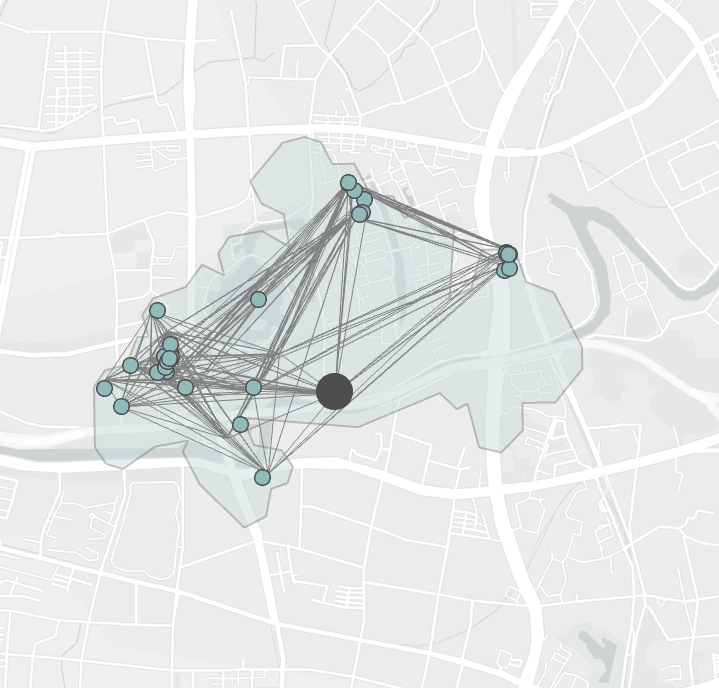
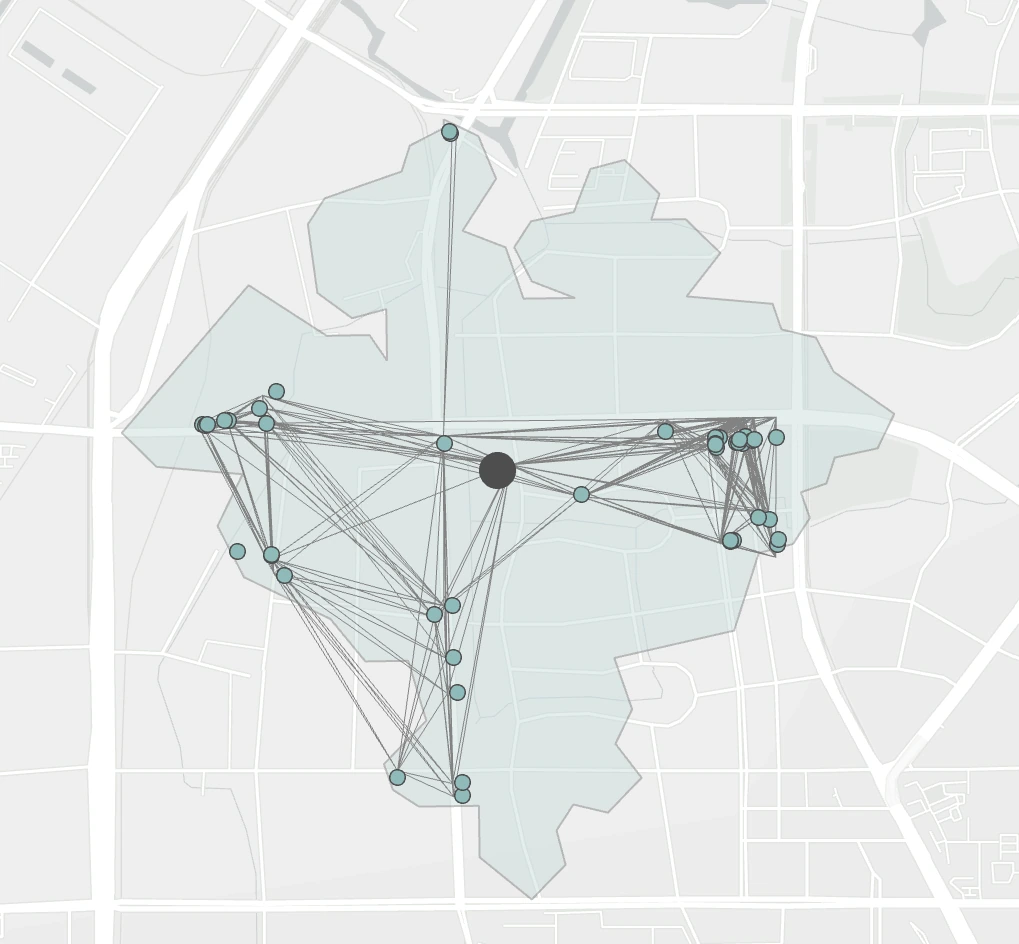
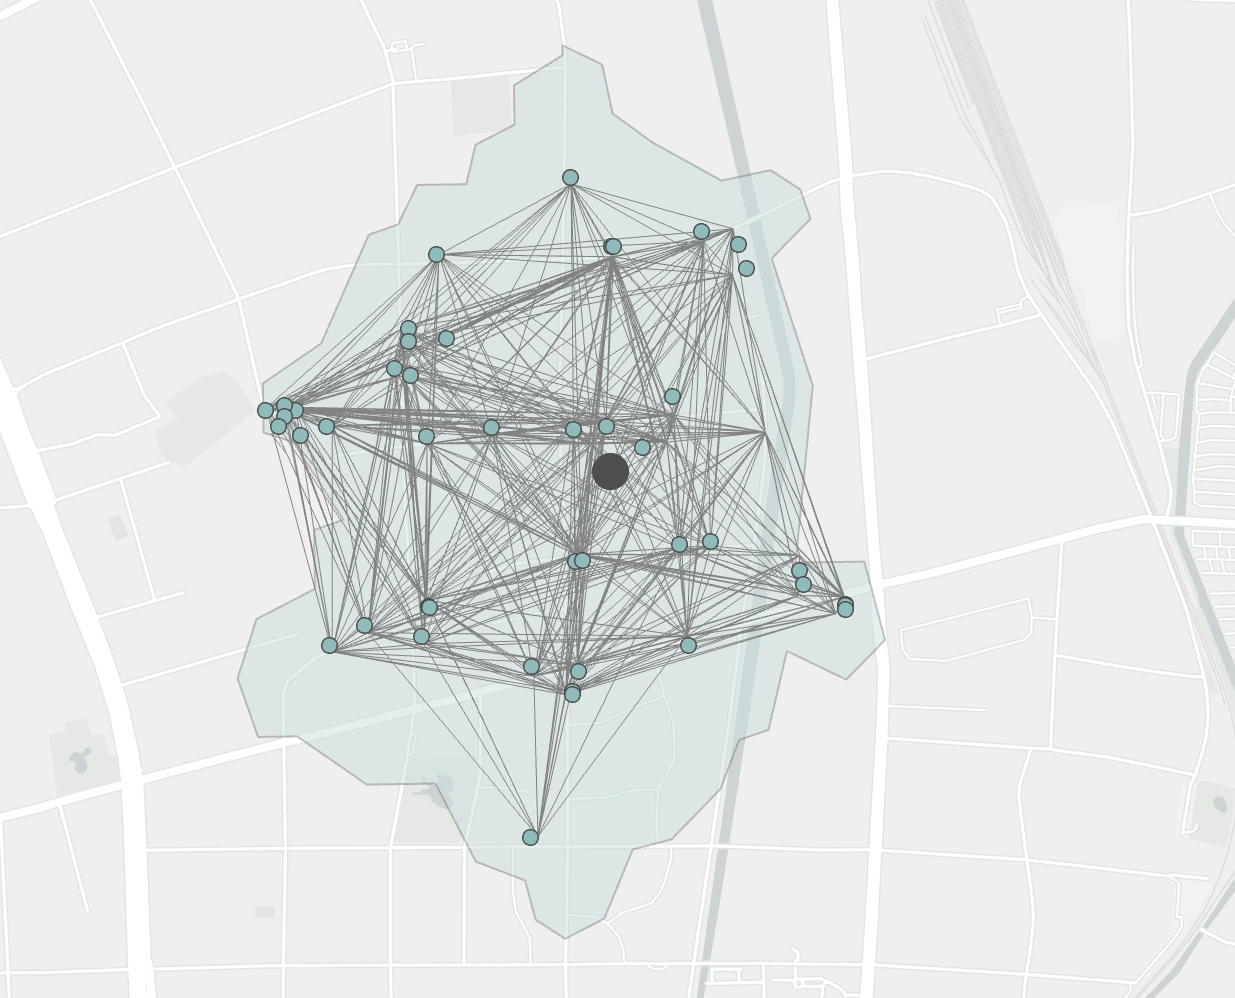
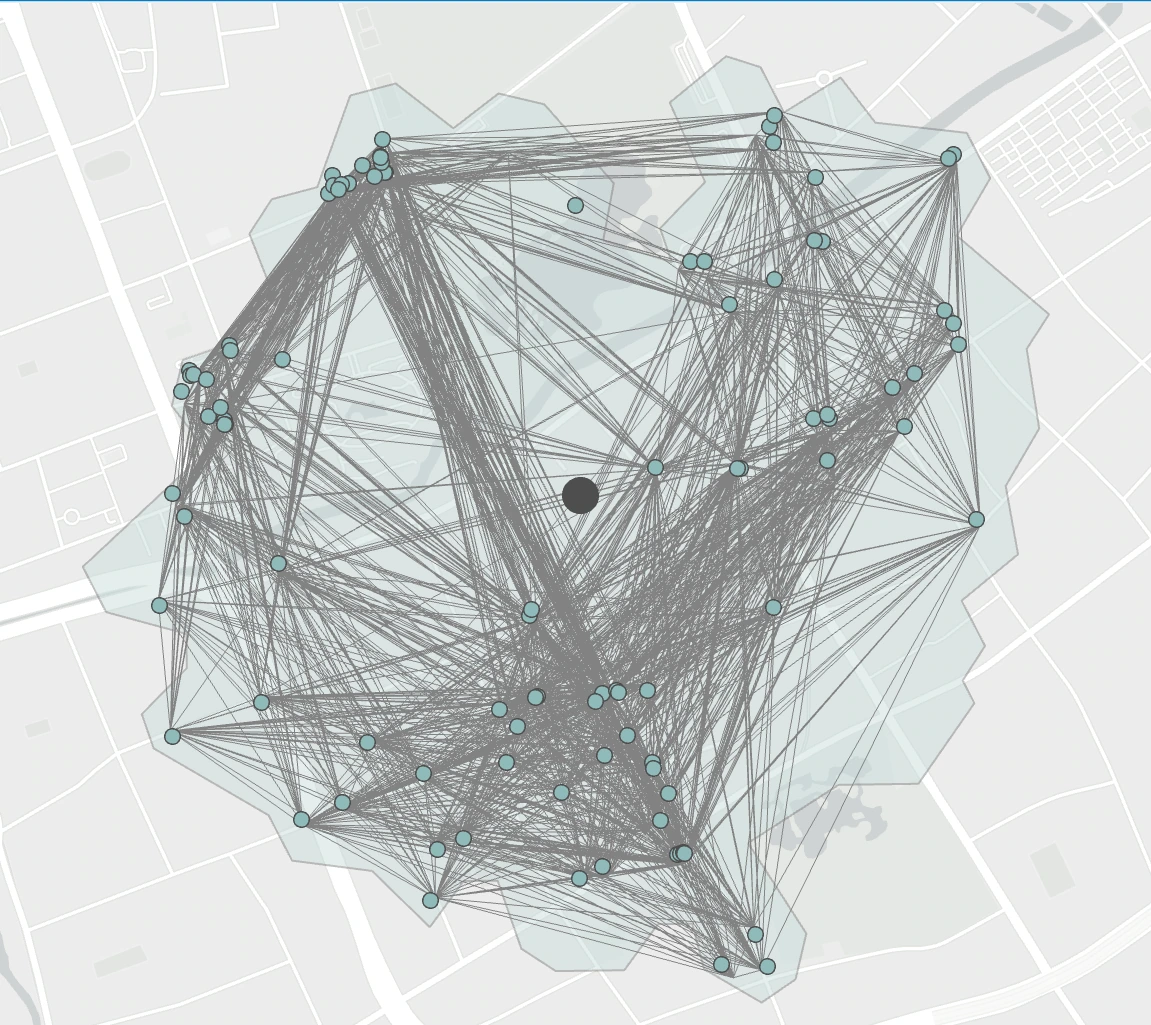
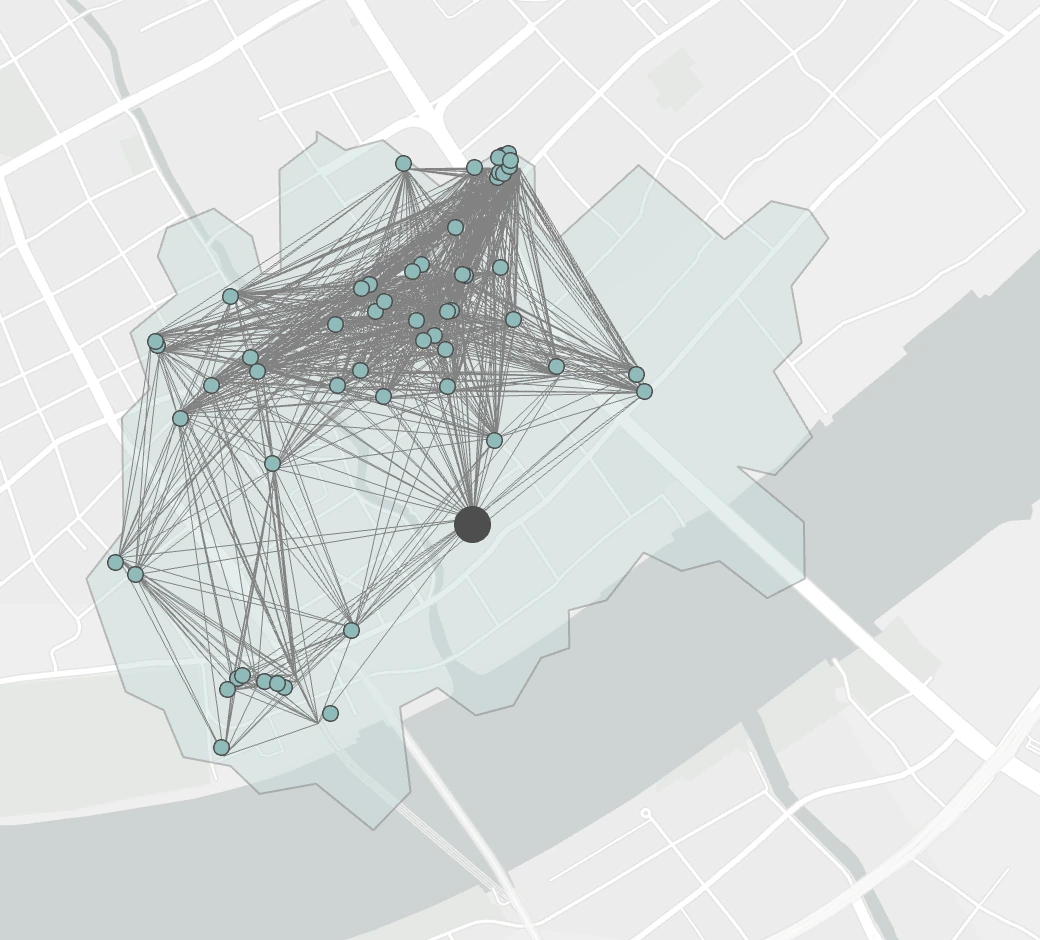
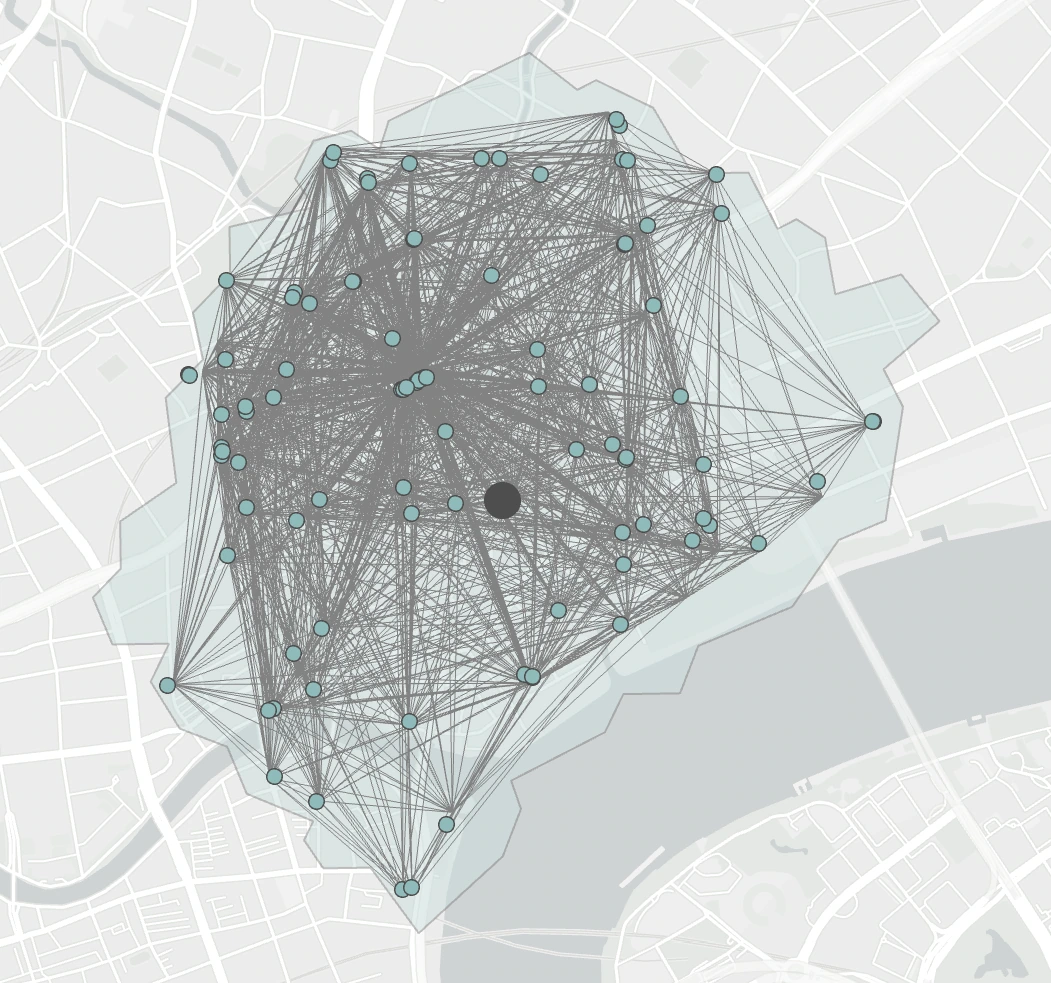
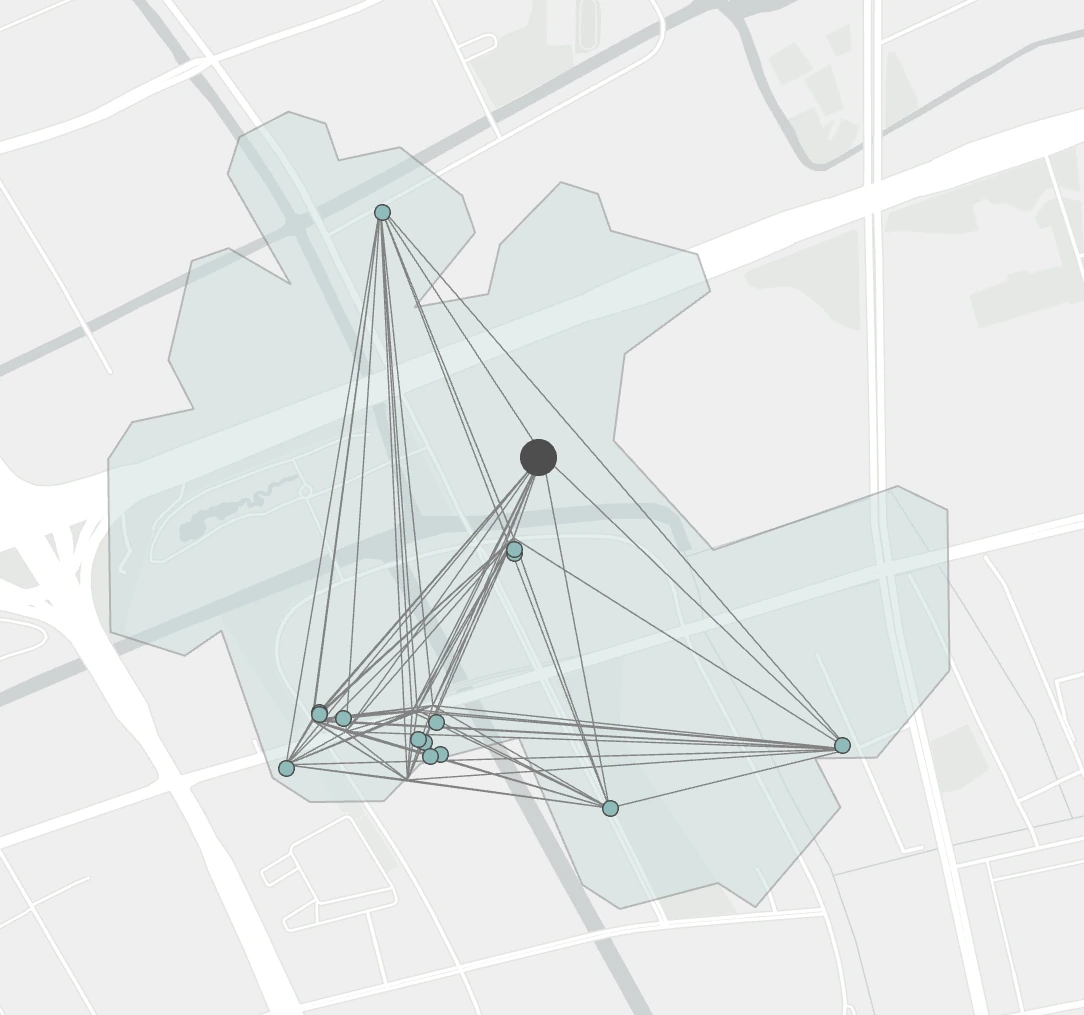
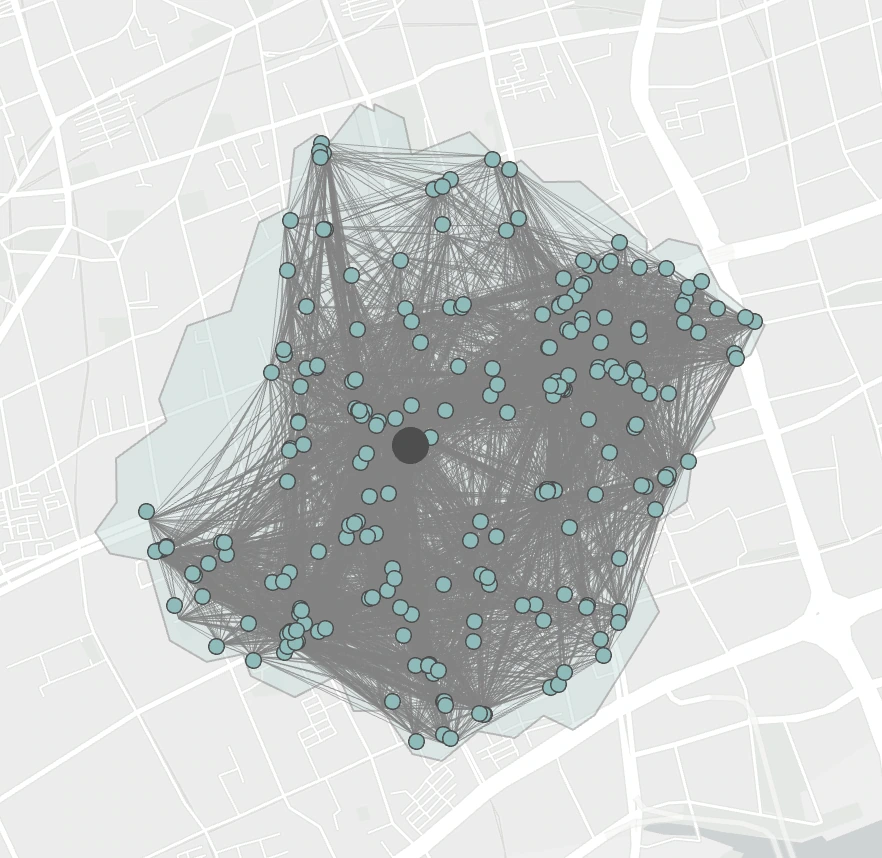
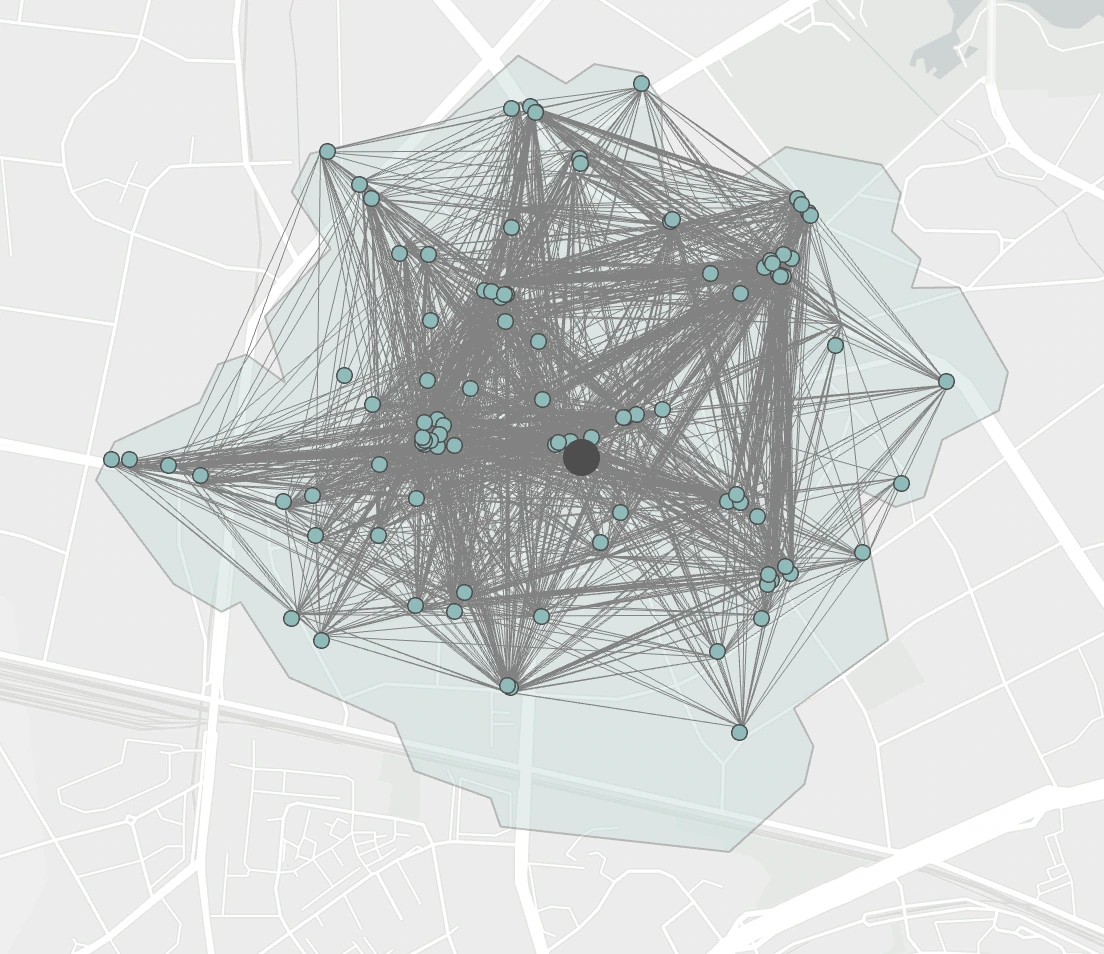
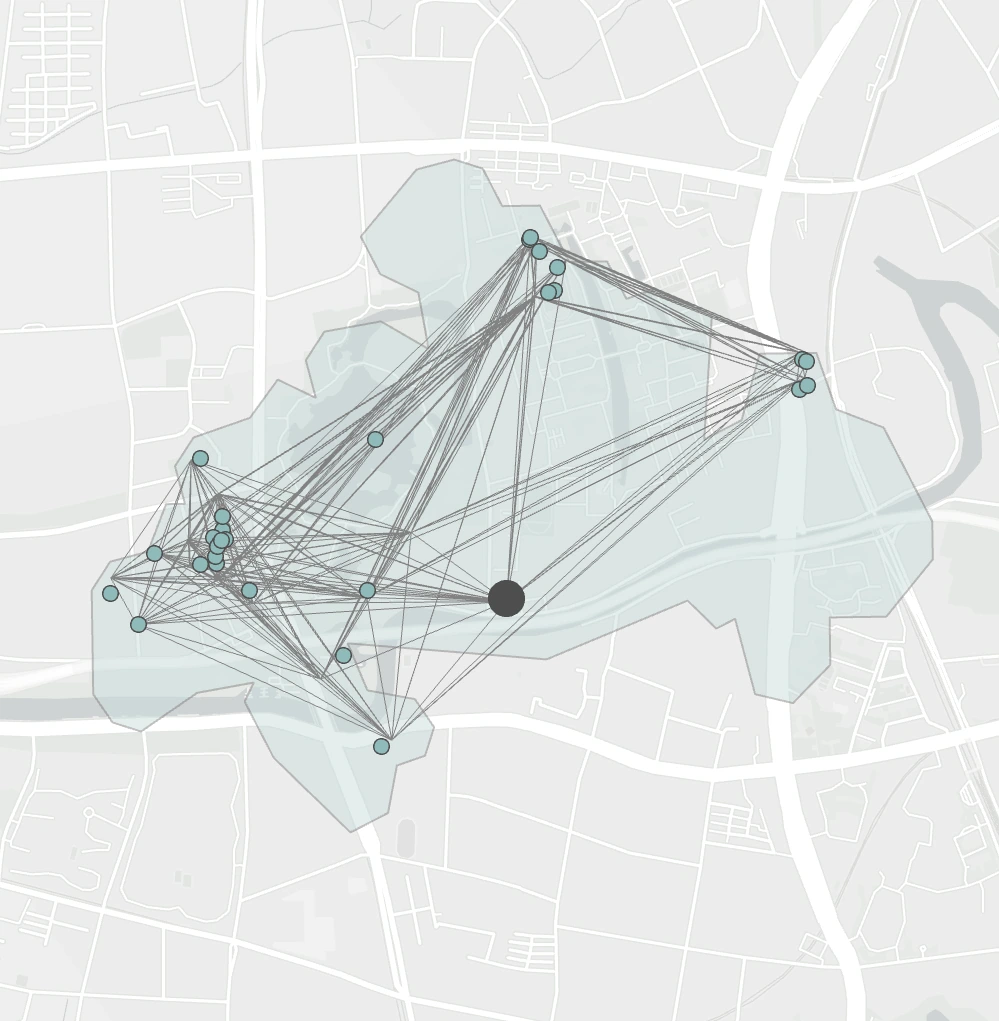
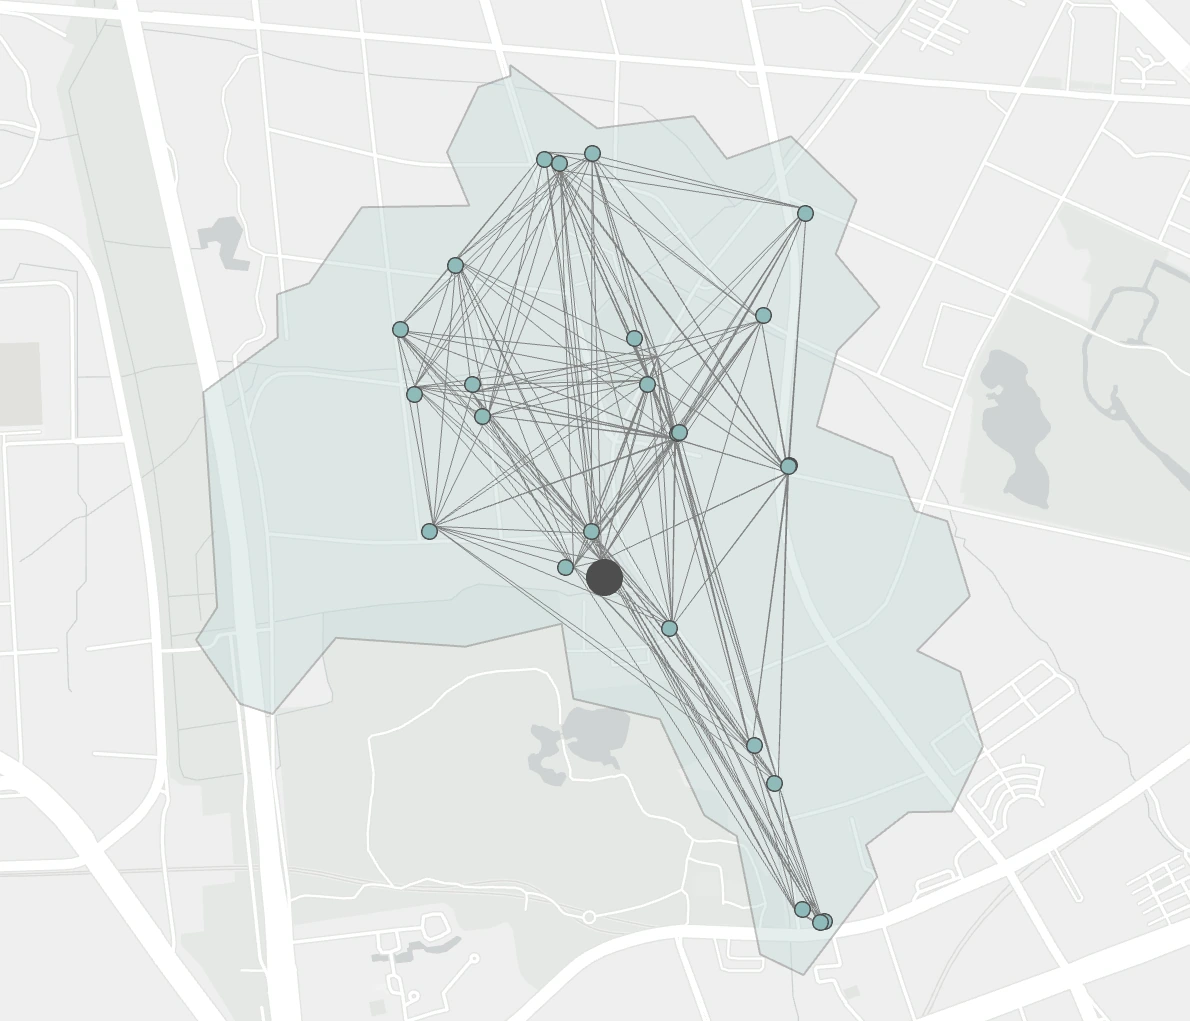
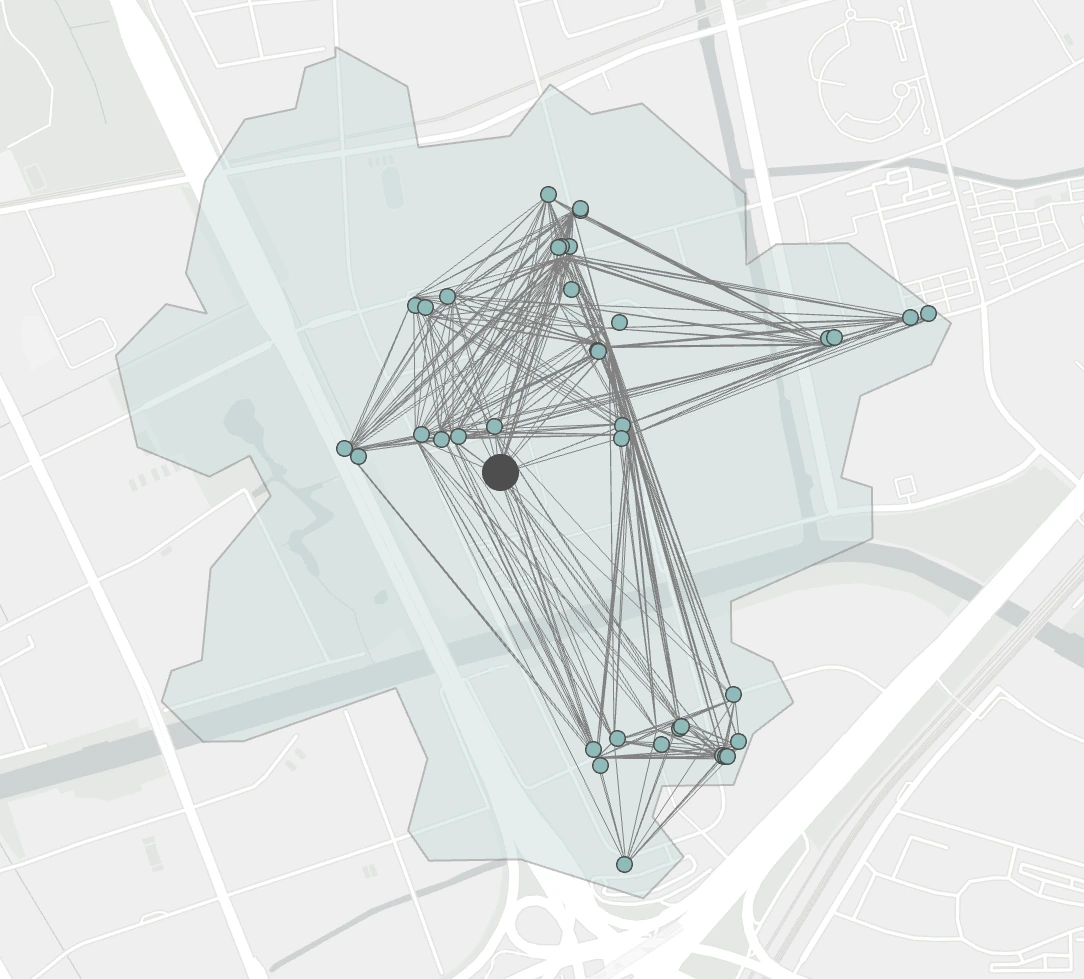
Twelve community subgraphs shown in sequence. Pause to inspect connections and facility distributions.
Labels and sampling
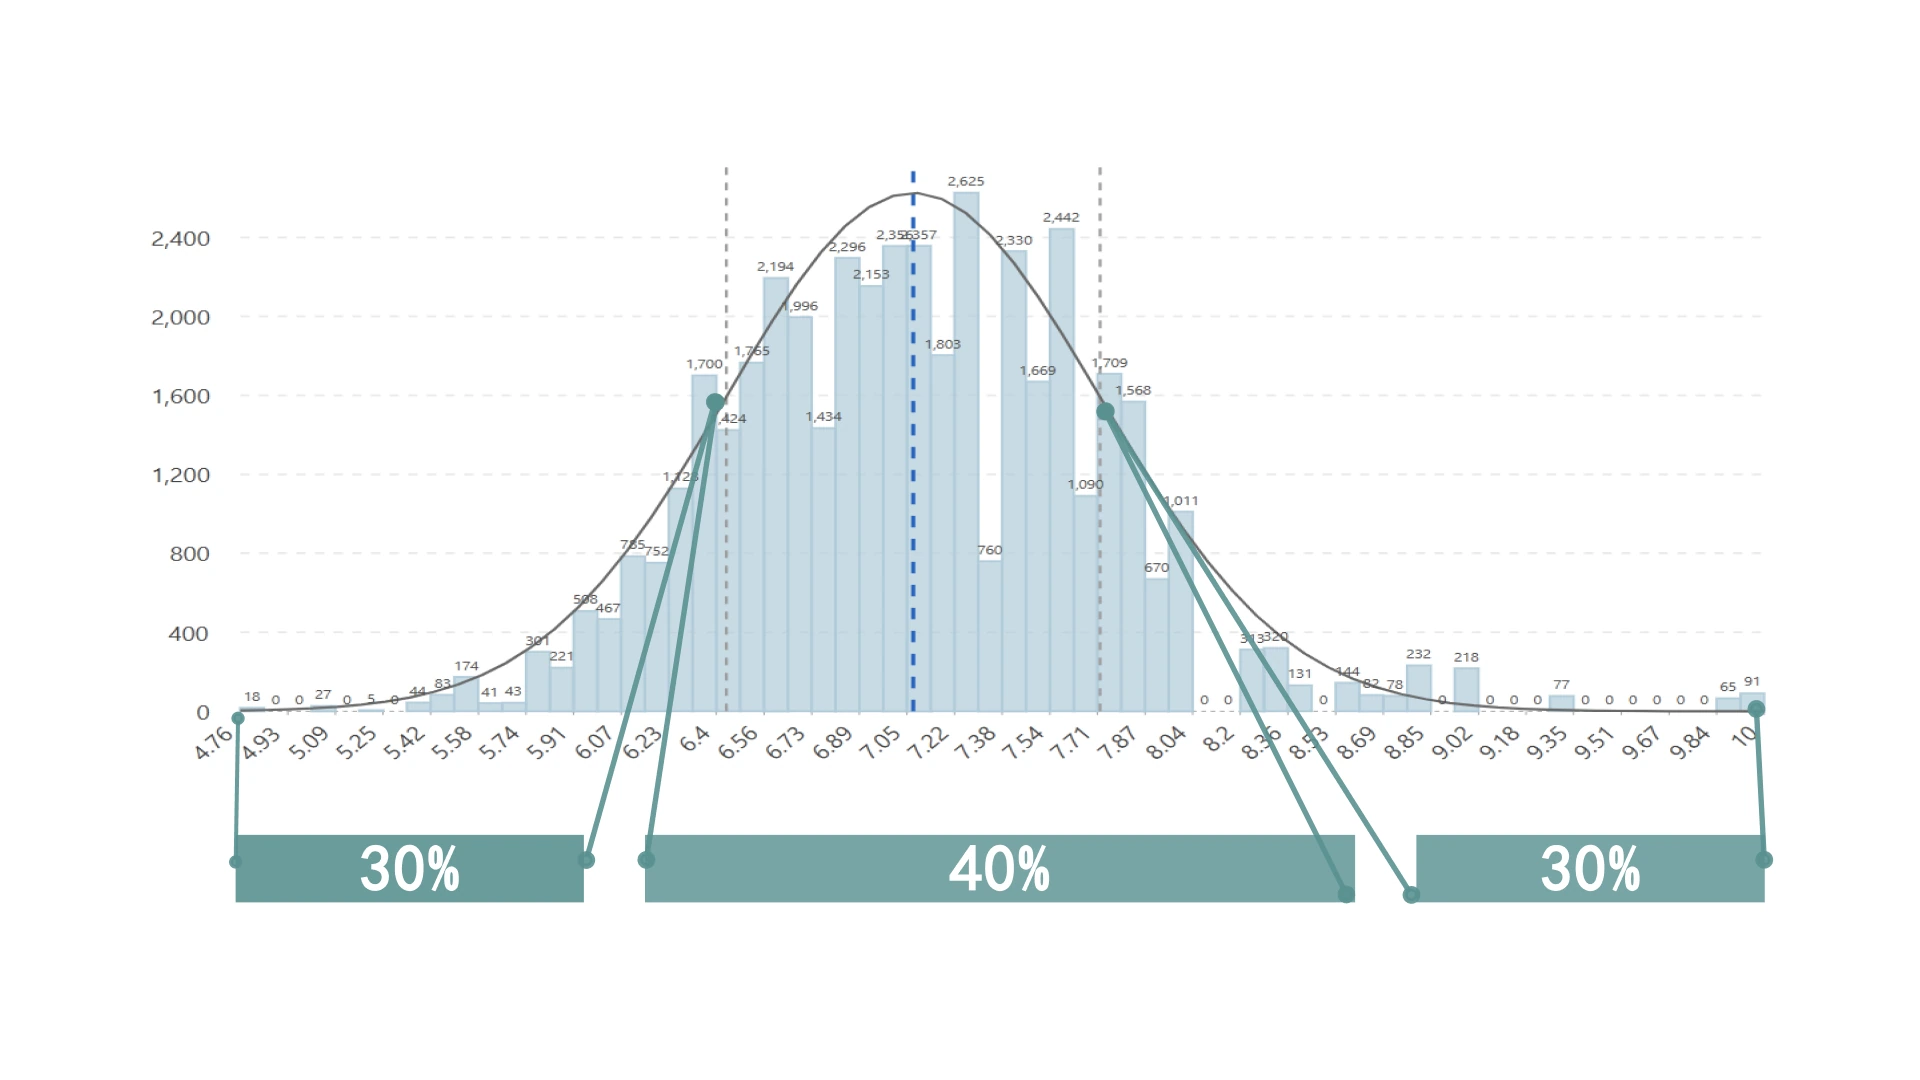
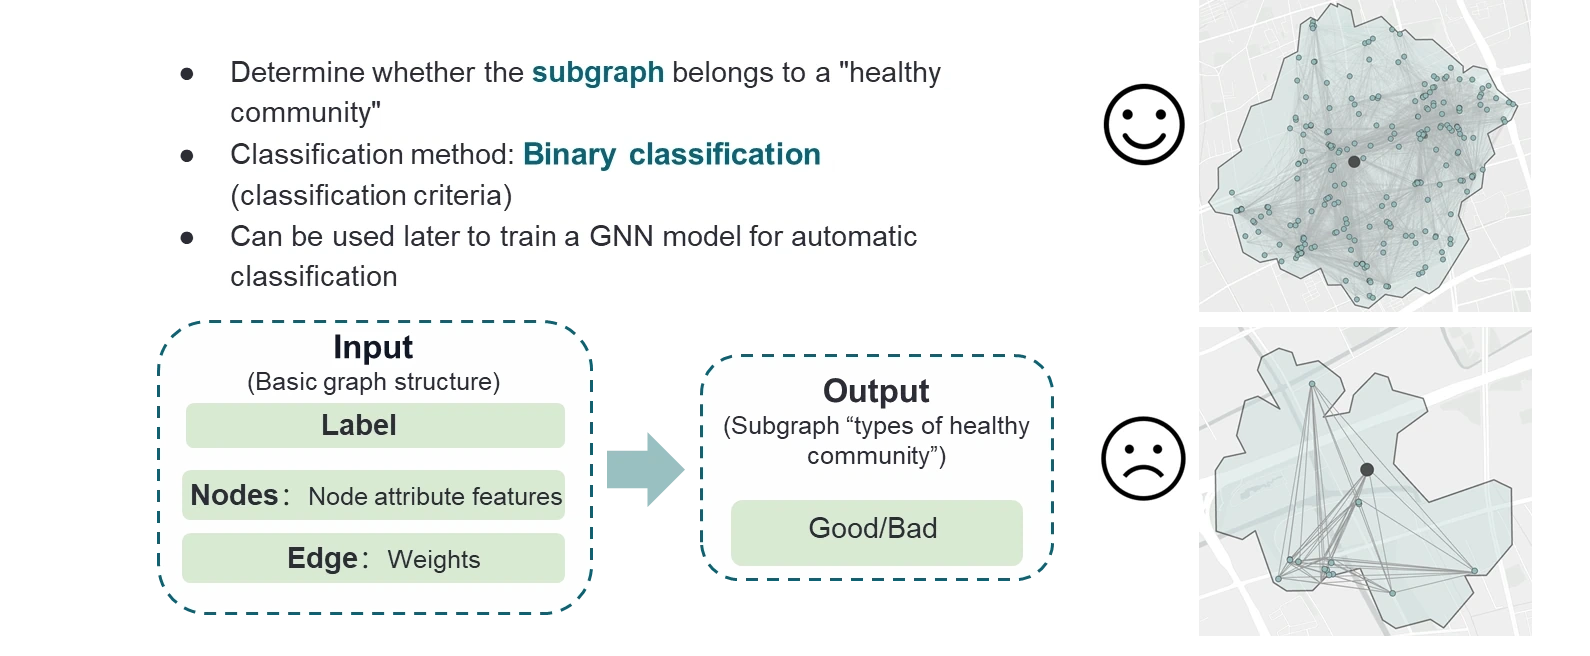
Assessment labels are constructed from selected spatial indicators. High-, middle- and low-score ranges guide sampling; the displayed modelling approach uses binary classification. These scores characterize the assessment framework, not individual health.
Training and evaluation
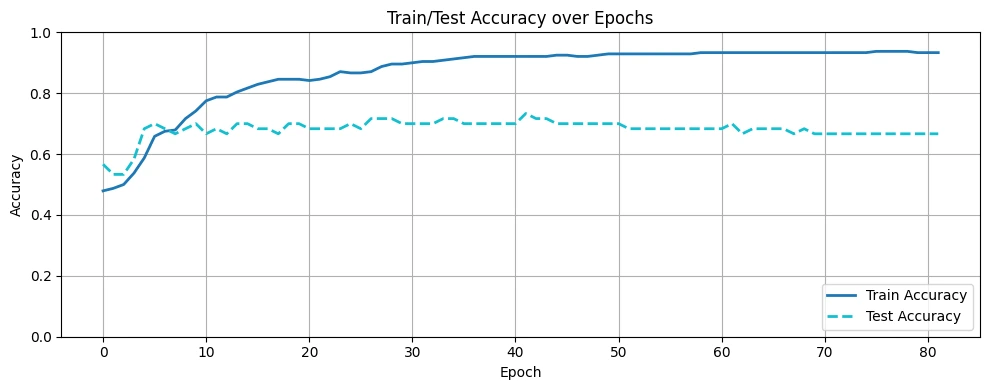
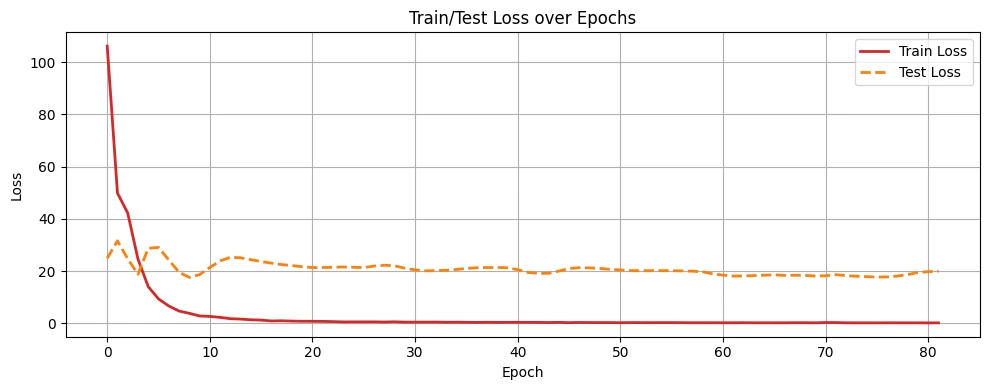
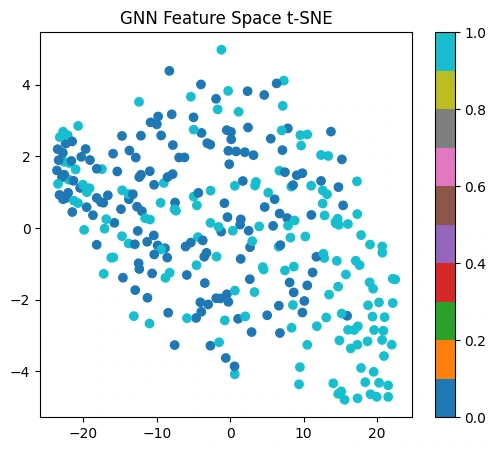
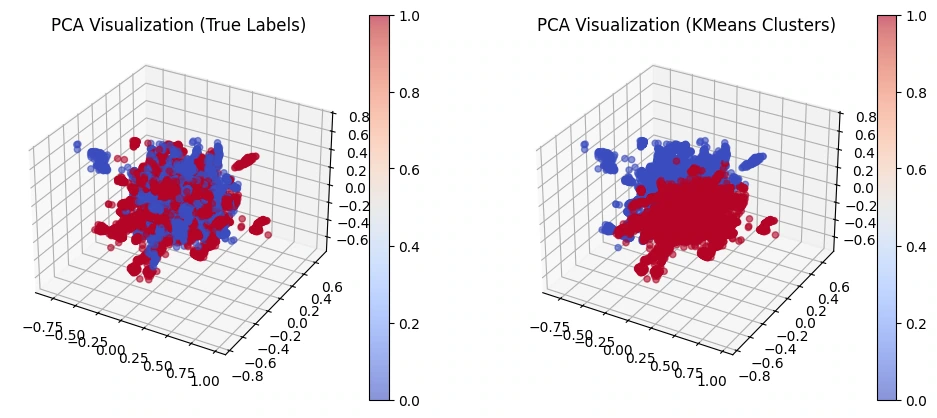
Training and test curves show both learning and a remaining performance gap. Embedding plots provide another view of the representation, but do not by themselves establish generalization.
Spatial interpretation
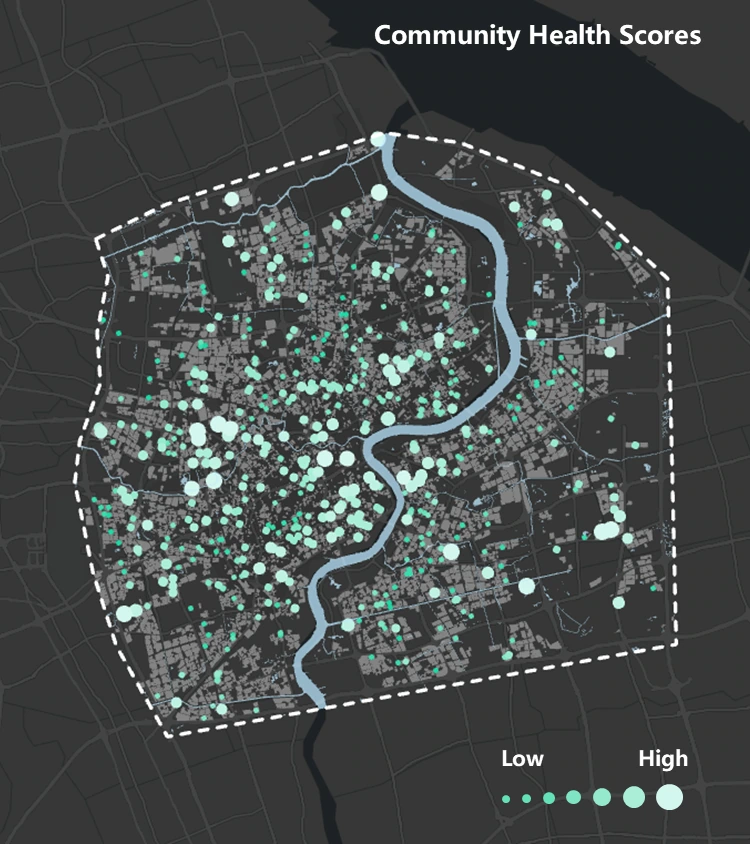
The mapped output locates variation in the model-derived scores. It provides a spatial view of the assessment rather than a direct measurement of residents’ wellbeing.
Independent interface development
After the workshop, I developed the interface, app layouts and visual details. These screens translate the analytical workflow into a navigable design, connecting community selection, overview and detailed indicators.
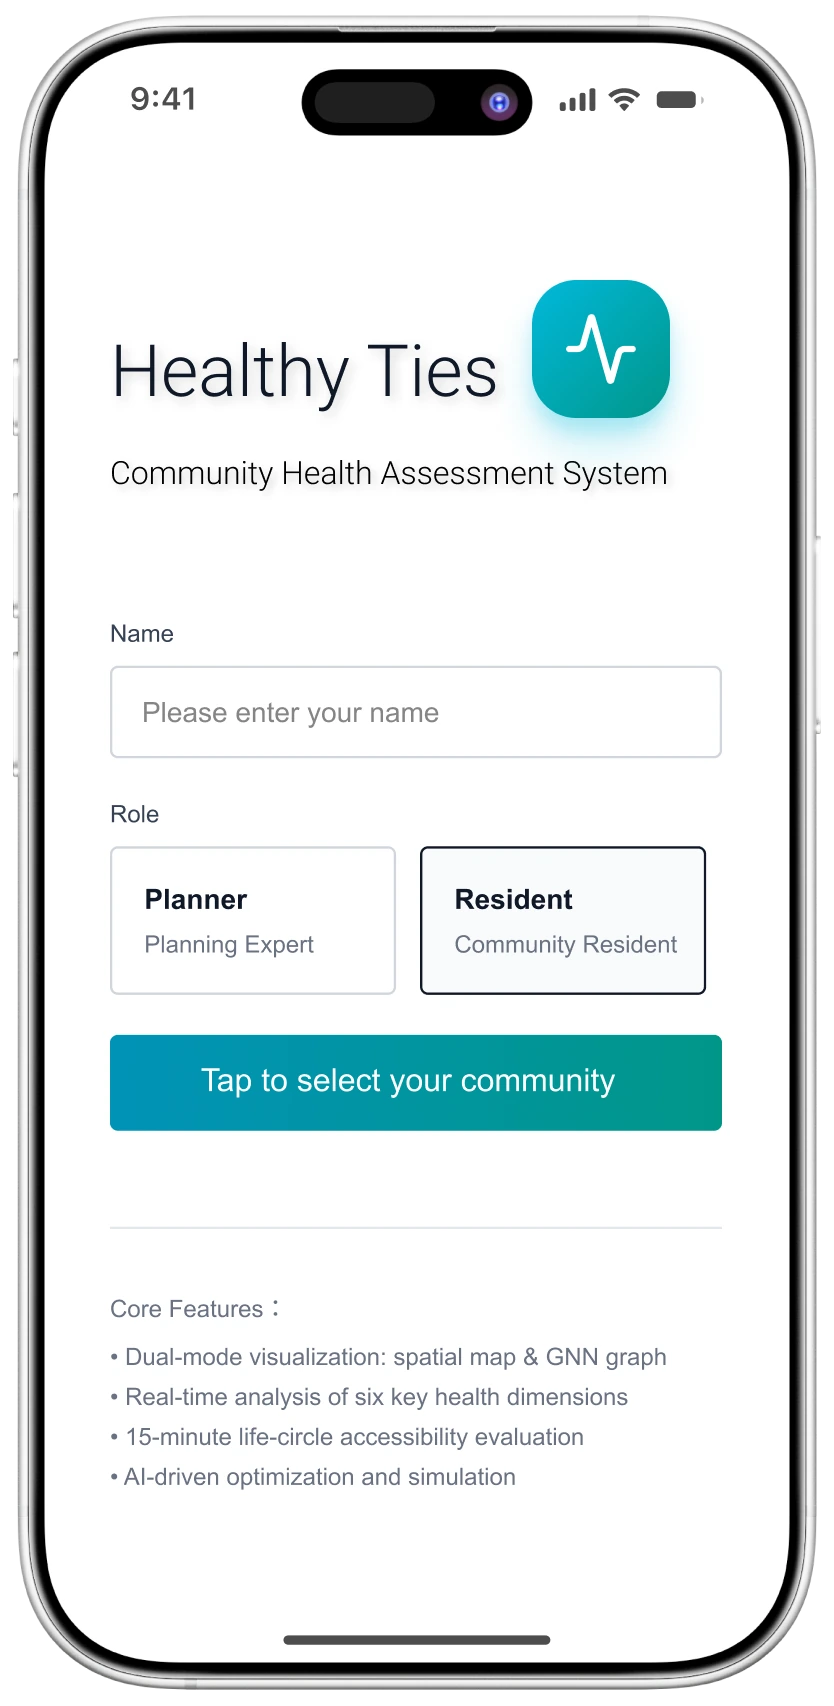
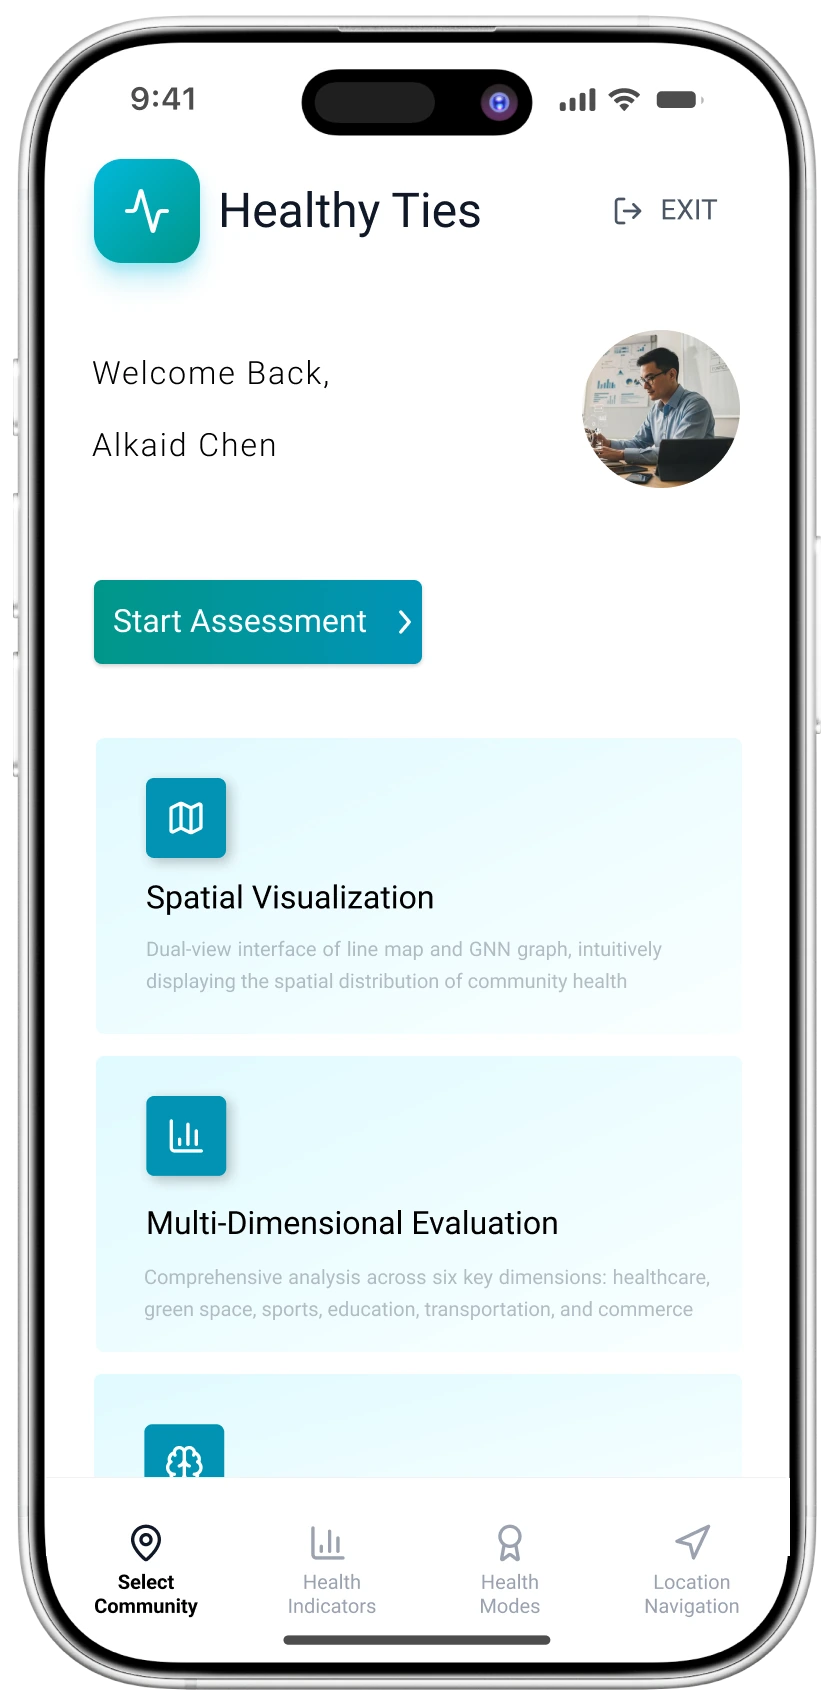
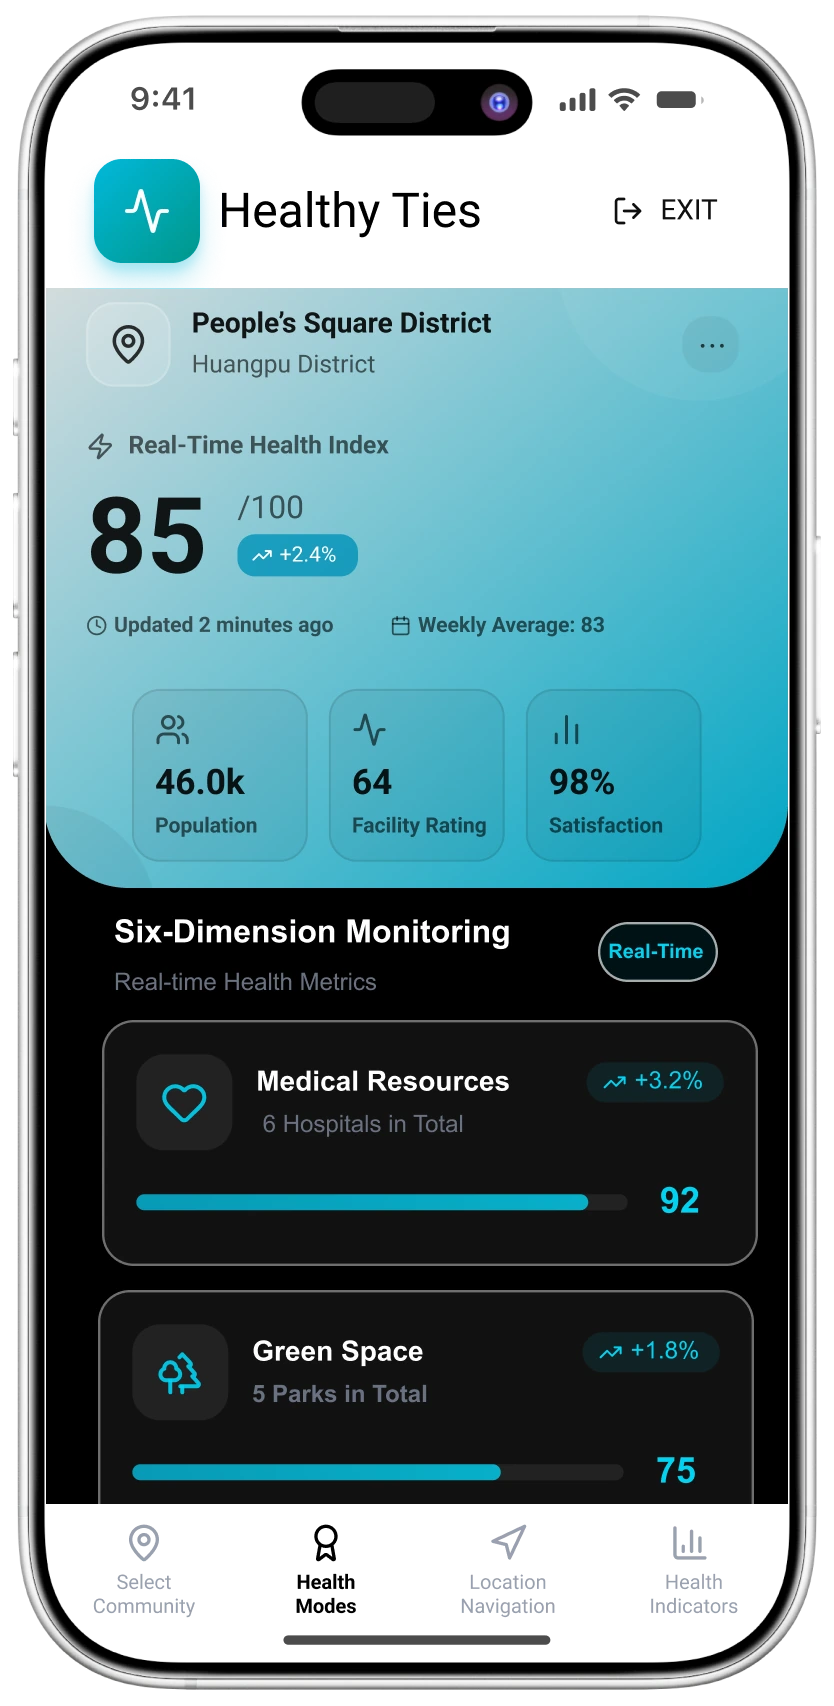
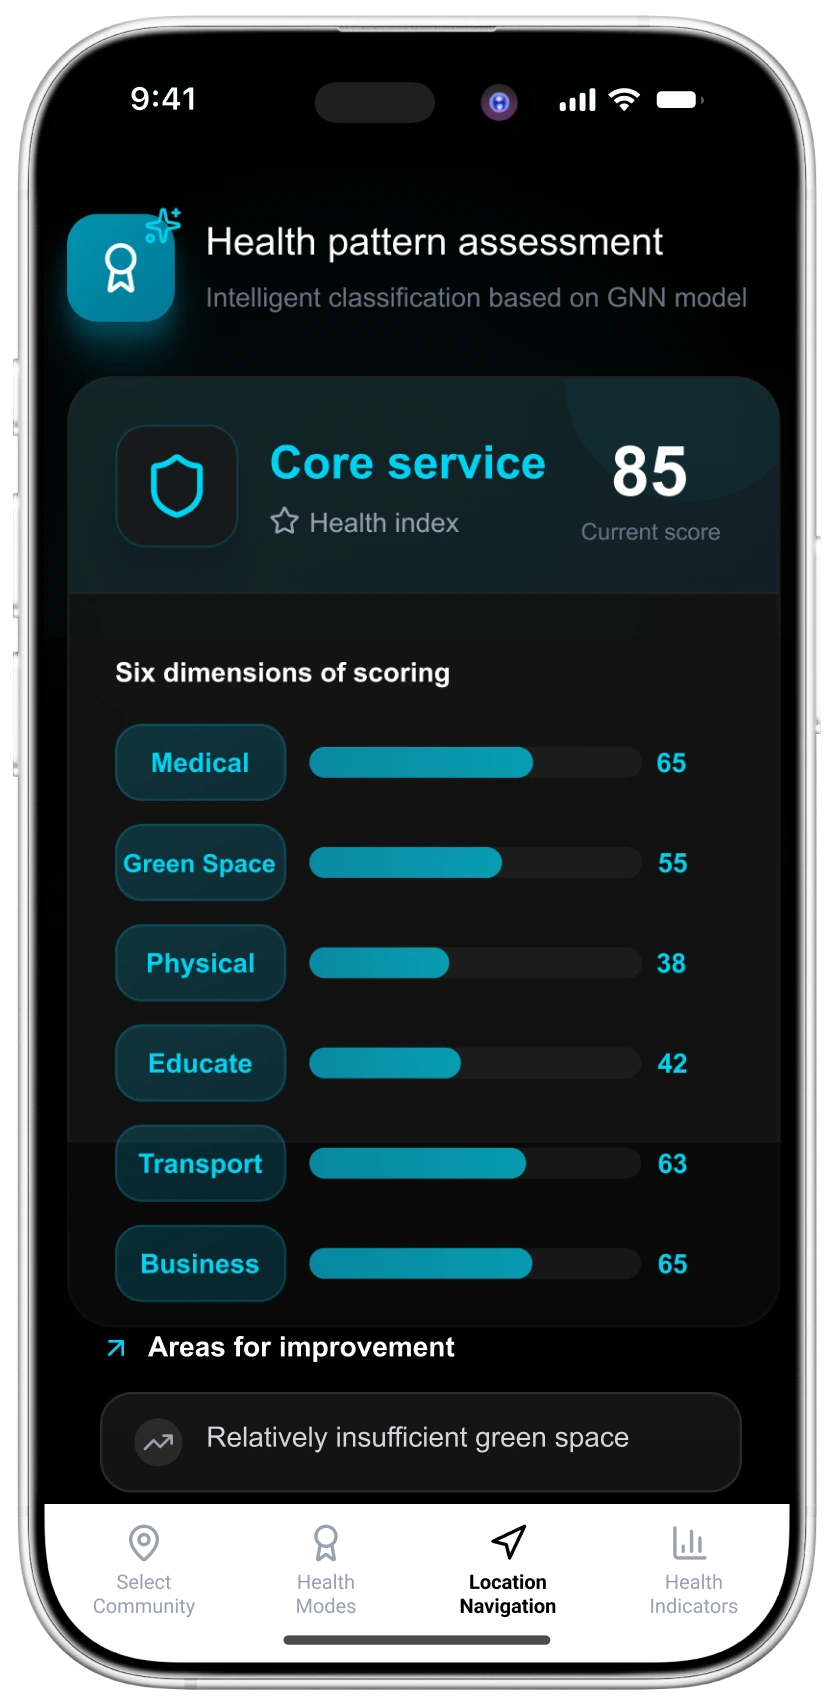
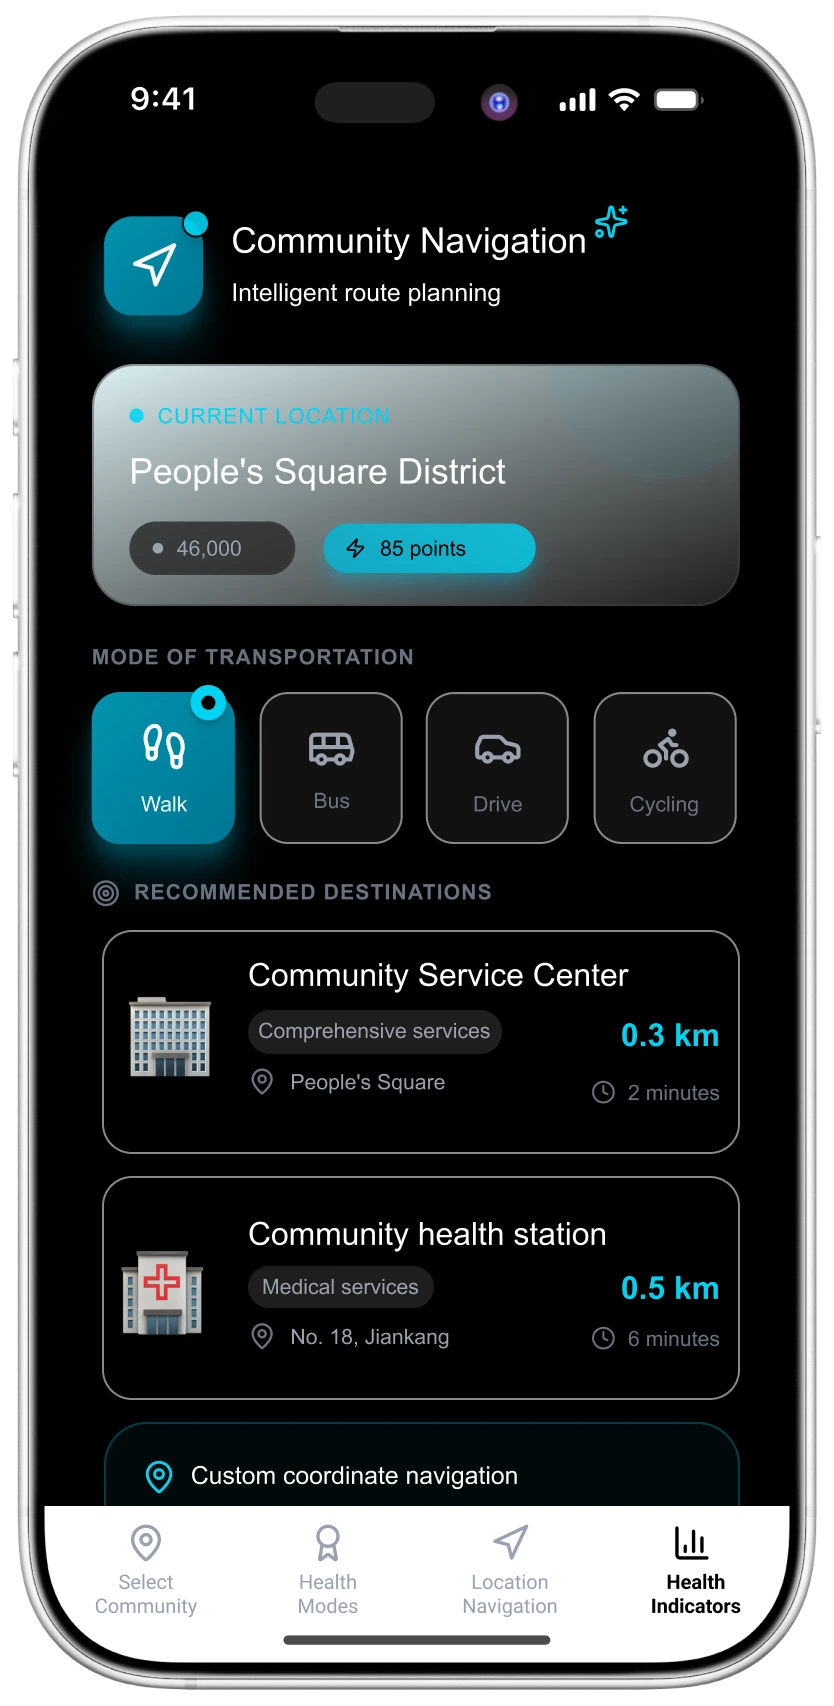
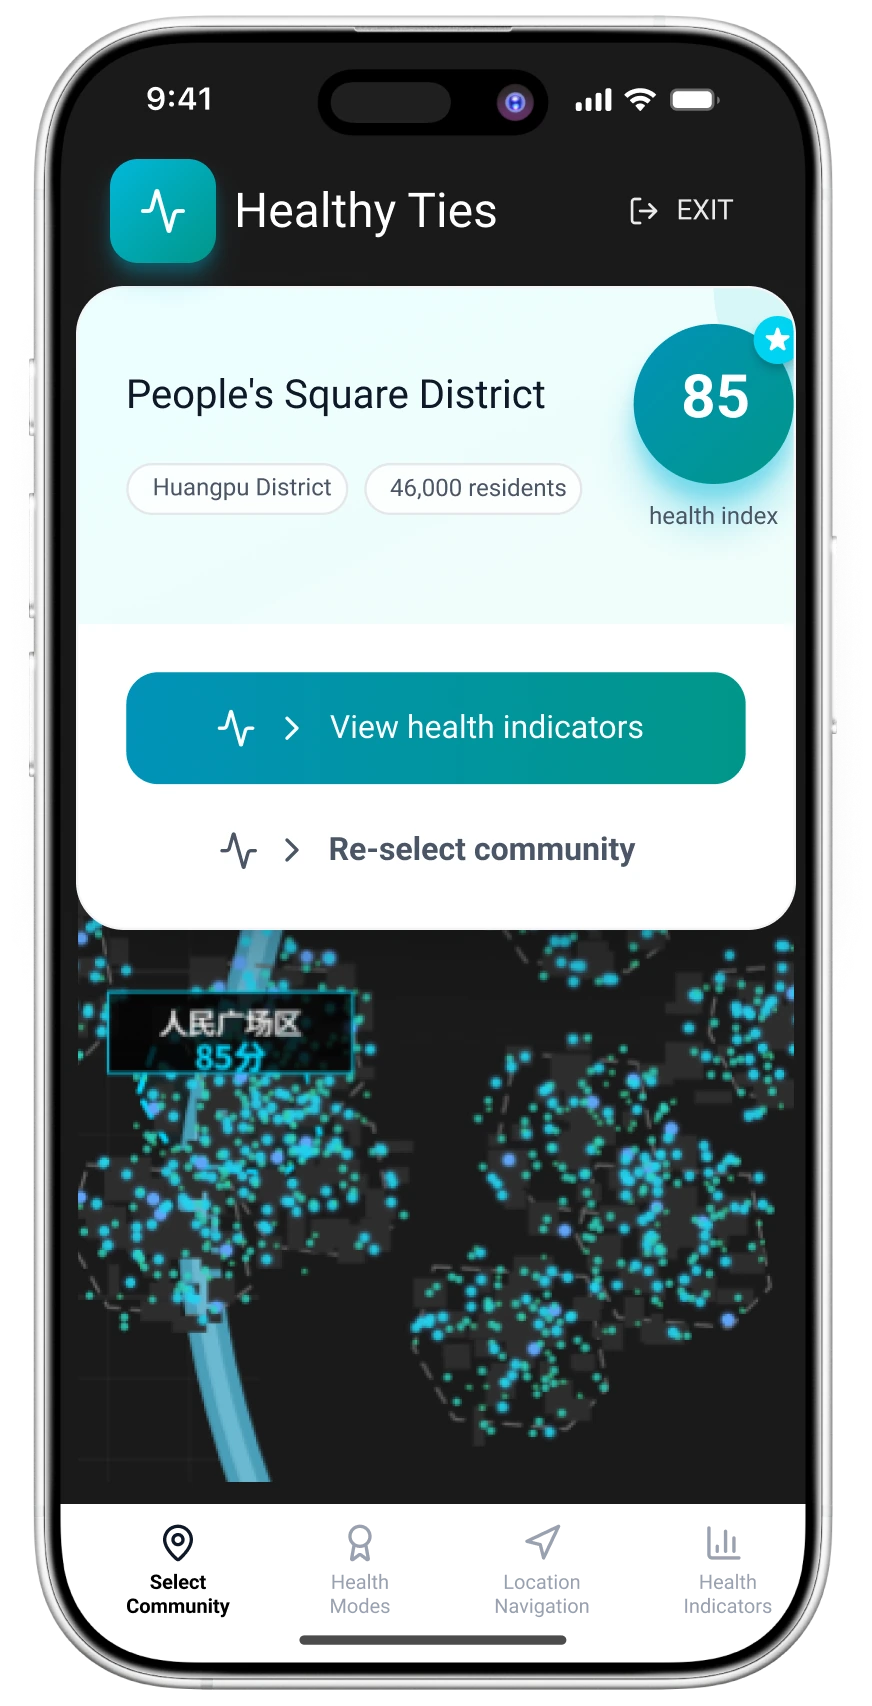
The workshop project was completed successfully. The subsequent independent work shown here is interface design; the screens do not imply a deployed app.